- February 20, 2025
- Posted by: Shane Daly
- Category: Trading Article

The tweezer candlestick pattern is one of the most straightforward yet powerful tools in technical analysis. It’s a formation that appears when two candles show matching highs or lows, signaling a potential market reversal. While it might look simple and very basic, there’s much more to understanding how these patterns can improve your trading decisions and help you spot these market turning points.
TLDR
- Tweezer patterns are reversal signals formed by two consecutive candlesticks with matching highs (tops) or lows (bottoms).
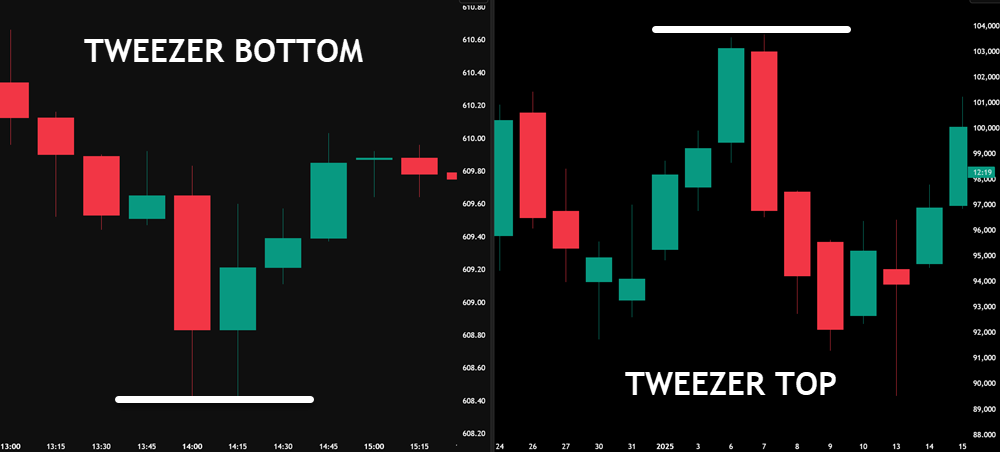
- A tweezer top forms when two candles share identical high points, with the first being bullish and second bearish.
- A tweezer bottom appears when two candles share identical low points, with the first being bearish and second bullish.
- The pattern’s reliability increases when formed near support or resistance levels and accompanied by strong trading volume.
- Trading tweezer patterns requires confirmation from subsequent candlesticks and proper stop-loss placement above tops or below bottoms.
What are Tweezer Candlestick Patterns?
The Tweezer Candlestick Pattern consists of two candlesticks with either matching highs (Tweezer Top) or lows (Tweezer Bottom). When you see this pattern, it could signal a reversal in the market trend.
When you spot a tweezer pattern, consider the overall market context and look for confirmation signals from other indicators or price action patterns. It’s a conservative and often safer approach to wait for the candlestick to close to validate the pattern before making trading decisions.
Combining tweezer patterns with other technical analysis tools can improve your trading strategy.
 Keep in mind that tweezer patterns are most reliable on higher timeframes and in conjunction with other analysis techniques. Practice identifying and interpreting these patterns in historical data to sharpen your skills and improve your trading performance.
By mastering tweezer candlestick patterns, you can gain an edge in predicting market reversals and optimizing your trading outcomes.
Types of Tweezer Patterns
Tweezer Patterns can be categorized into Tweezer Tops and Tweezer Bottoms, which are essential for traders to recognize. Tweezer Tops typically appear at the peak of an uptrend, hinting at a potential trend reversal.
Tweezer Bottoms form at the end of a downtrend, suggesting a possible shift towards an upward trend.
By understanding these patterns, traders can gain insights into market sentiment and make educated trading decisions. When you spot a Tweezer Top, it might be a sign to consider selling or taking profit if you’re in a long position.
Conversely, identifying a Tweezer Bottom could indicate a good opportunity to consider buying or entering a long position.
Being able to differentiate between Tweezer Tops and Tweezer Bottoms can help you anticipate potential market movements and adjust your trading strategies accordingly.
Tweezer Tops
When analyzing price charts, keep an eye out for Tweezer Tops, a critical pattern signaling a potential trend reversal. These formations play a key role in technical analysis by indicating shifts in market sentiment and price movements.
Tweezer Tops involve two candlesticks with nearly identical highs, showing a battle between buyers and sellers. Typically, the first candlestick is bullish, followed by a bearish one of similar height, creating a peak.
This pattern hints at a change in power from buyers to sellers, potentially signaling the end of an upward trend.
Traders often use Tweezer Tops to review their positions and gauge the possibility of a downtrend emerging in the market.
Tweezer Bottoms
Tweezer Bottoms are key candlestick patterns in technical analysis that signal a potential trend reversal in a downtrend. These patterns are good for traders as they act as indicators of possible changes in market direction when they appear at support levels.
When you spot Tweezer Bottoms, you’re looking at two candles with identical lows, hinting at a shift in price movement. Traders who rely on technical analysis can interpret Tweezer Bottoms as bullish signs, especially when they follow a prolonged downtrend.
Understanding Tweezer Bottoms and their significance in price action is vital for anticipating trend reversals and finding trading opportunities.
Keep an eye out for Tweezer Bottoms as they offer valuable insights into potential shifts in market sentiment.
Tweezer Pattern Checklist
To assess the tweezer candlestick pattern , combine candlestick analysis with technical indicators and price action. It’s never a bad idea to confirm the pattern’s signals by cross-referencing with other tools like moving averages or support/resistance levels.
This approach can improve the accuracy of this and other trading patterns.
- Identify a clear uptrend for Tweezer Tops or a downtrend for Tweezer Bottoms
- Locate two adjacent candles with equal highs (Tweezer Top) or equal lows (Tweezer Bottom)
- The first candle should be strong and in the direction of the trend
- The second candle should be the opposite color and open near the close of the first candle
- Look for confirmation from other indicators or price action
This checklist can be helpful, especially during your testing phase of designing your trading strategy.
Keep your rules rigid when you begin and when gaining experience, you will find nuances to any strategy that suit you better.
How to Trade Tweezer Patterns
When trading Tweezer Patterns, it’s essential to have a structured approach in place. This involves using a Tweezer Trading Checklist that helps you identify the pattern, look for confirmation signals from other indicators, and determine entry and exit points.
By sticking to that checklist, you can make more decisions based on the signals given by Tweezer Patterns.
When it comes to entering a trade based on Tweezer Patterns, consider waiting for the confirmation of the next candle after the Tweezer formation. This can help reduce the risk of failed trades and improve the accuracy of your trades.
As for exit points, you may want to set stop-loss orders to protect your profits and limit potential losses.
Tweezer Bottom Candlestick Pattern
Are you looking for a trend reversal or a continuation of the trend?
- Price is in an uptrend, and makes a corrective decline, you look for a Tweezer bottom reversal
- Up-trending price forms a sideways consolidation. Traders look for Tweezer bottom reversal near the bottom of the range or just under the support level
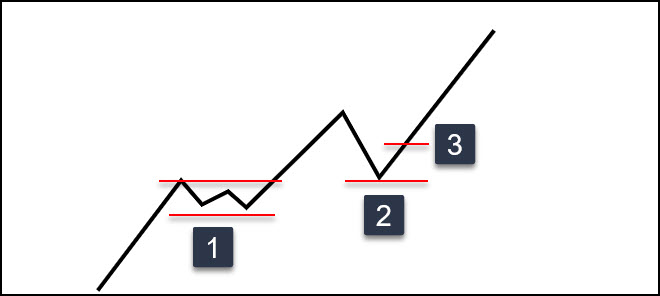
In this example, the overall trend direction is up.
- Finding a Tweezer bottom at that bottom red line or just under the top red line (resistance)
- Corrective decline reversal zone
- After the reversal, the price can often pause and Tweezer bottom can be played
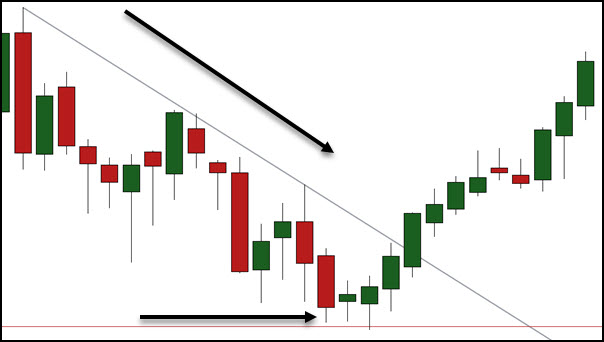
The price is in a downtrend. A Tweezer bottom is put in at the red line which is a former resistance level now acting as support. Finding reversals during a corrective decline can be tricky. Using the Tweezer bottom to show a potential change in direction can add to your entry tools.
How? Notice the second candlestick.
Often you will find the second candlestick is an inside bar. An inside bar is simply consolidation on a lower time frame.
You can use a break of the high of the inside candlestick for your trade entry with your stop loss below the low of the two-candle pattern.
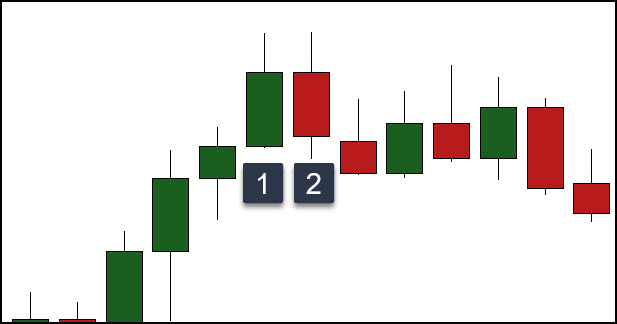
Tweezer Top Candlestick Pattern
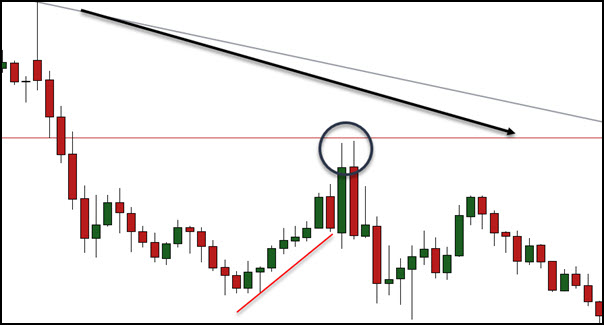
For the bearish Tweezer, we are looking for the end of an uptrend or a reversal of the corrective rally of a pullback in a down-trending market.

This is interesting as we have 3 equal highs in this uptrend.
However, the second candlestick in the middle is green and we want to see it to be a bearish candle. We get that as a hanging man in the third candlestick giving you a potential trade signal short.
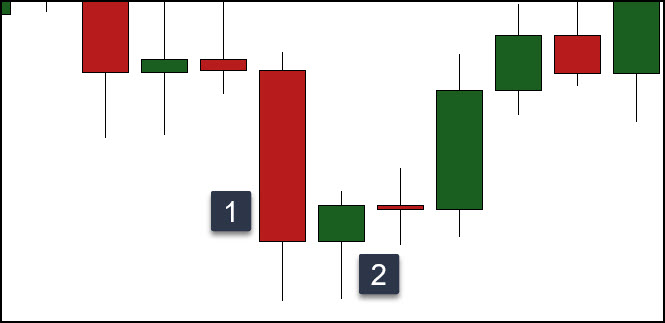
This is a bearish trend and a corrective rally.
We see a strong momentum bullish candle, the tweezer top candlestick pattern sets up a former support level turned resistance, and the price collapses with a strong move forming a bearish candle.
This is still an inside candle and we can just play a break of the low of candlestick two once this sell signal sets up.
Tweezer Pattern Trading Tips
To improve your trading strategies based on the Tweezer candlestick pattern, it’s essential to validate signals with additional technical indicators. While Tweezer patterns offer insights into potential market movements, it’s wise to supplement them with tools like moving averages, RSI, or MACD.
These indicators can help confirm the signals given by the Tweezer pattern, leading to more informed decisions.
Tweezer With Moving Average
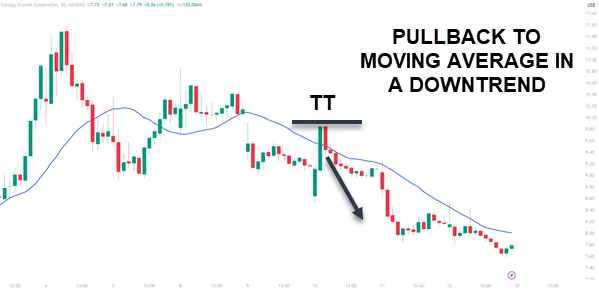
In this example, the moving average is heading downwards as the price is putting in lower highs:
- downtrend in place
- look for a tweezer top around the area of the moving average
- short the second candlestick of the pattern
Tweezer With Support (or Resistance)
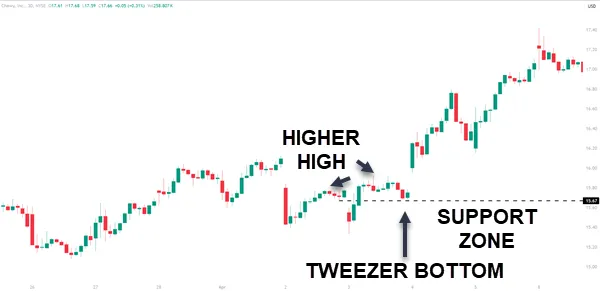
In this example, the price was in an overall uptrend as seen by the price action. A correction occurs and the price begins to resolve with a higher high.
- Price is in an overall uptrend
- Price puts in higher high during consolidation
- Tweezer Bottom occurs at minor support
- Buy above the high of the second candlestick
- Stop loss goes below the pattern
Tweezer With RSI Overbought and Fib Zone
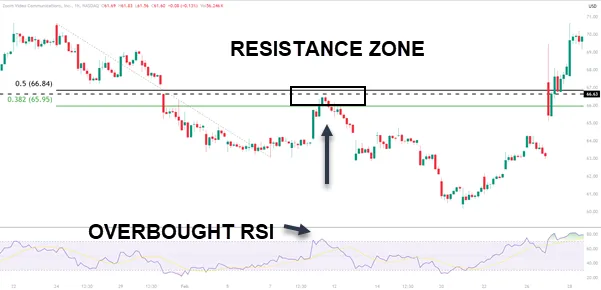
In this example, the price has pulled back into a structure resistance zone, a Fibonacci retracement zone, and an overbought RSI.
- A confluence of technical factors points towards a downward move in price
- Sell stop below the low of the second candlestick
- Stop loss goes above the high of the pattern
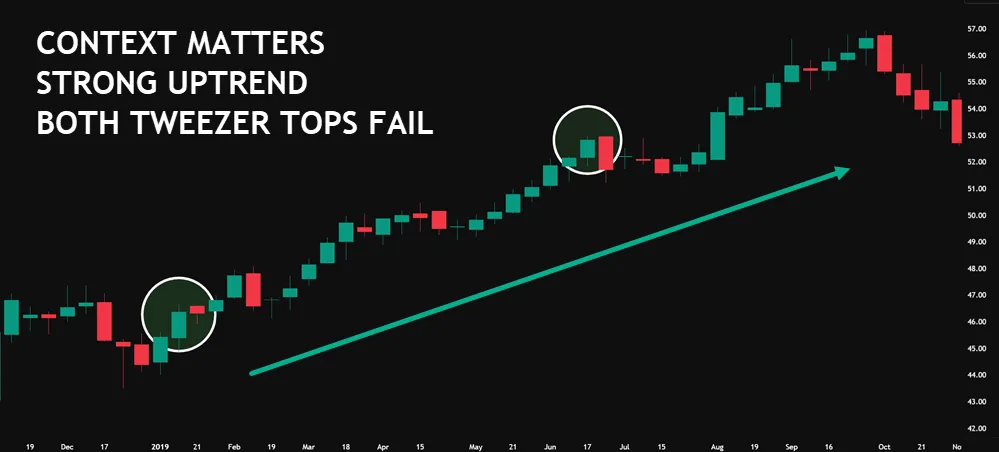
Considering broader market trends is also crucial when utilizing Tweezer patterns in trading. Understanding the overall market sentiment and direction provides important context for individual candlestick formations.
Analyzing Tweezer patterns within the context of the prevailing trend is key for higher probability trades. By combining market trends with Tweezer patterns, traders can increase the likelihood of successful trades.
Your Questions Answered
How Does Cryptocurrency Market Volatility Affect the Reliability of Tweezer Patterns?
You’ll find crypto’s high volatility creates more frequent but less reliable tweezer patterns, making it harder to trust these signals without additional confirmation from other technical indicators.
Can Tweezer Patterns Be Effectively Combined With Elliott Wave Theory?
You can effectively combine tweezer patterns with Elliott Wave Theory, as they’ll confirm potential wave completions and reversals. They’re particularly useful at fifth wave endings and corrective phase conclusions.
What Is the Average Success Rate of Tweezer Patterns Across Different Markets?
You’ll find success rates vary between 60-80% in forex and around 65% in stocks, with higher accuracy of 70-75% when patterns form at support levels or during specific trends.
Do Tweezer Patterns Work Better in Specific Trading Sessions or Time Zones?
You’ll find tweezer patterns most effective during the London-New York session overlap, when higher trading volumes and volatility create stronger reversals and more reliable market movements.
How Do Stock Splits and Corporate Actions Impact Tweezer Pattern Analysis?
You’ll need to adjust your tweezer analysis after stock splits, as they change price levels and volume patterns. Corporate actions can create misleading signals by causing unusual price movements and volatility.
1 Comment
Comments are closed.
Thank you very much for your nice and clear explanation