The kicker candlestick pattern (kicking pattern), is a two candle bullish and bearish reversal pattern. It is a strong sign of the reversal of who is currently in control of the instrument you are trading.
The market is a constant battle between buyers and sellers and the kicking pattern shows an obvious sentiment shift in the market clearly favoring one side, even if only in the short term.
This pattern generally happens when news that will affect the market is released after market closes. Upon opening, traders adjust their positions, exit, or even enter trades.
Understanding the psychology of kicking pattern is important as opposed to the perfect example of the pattern
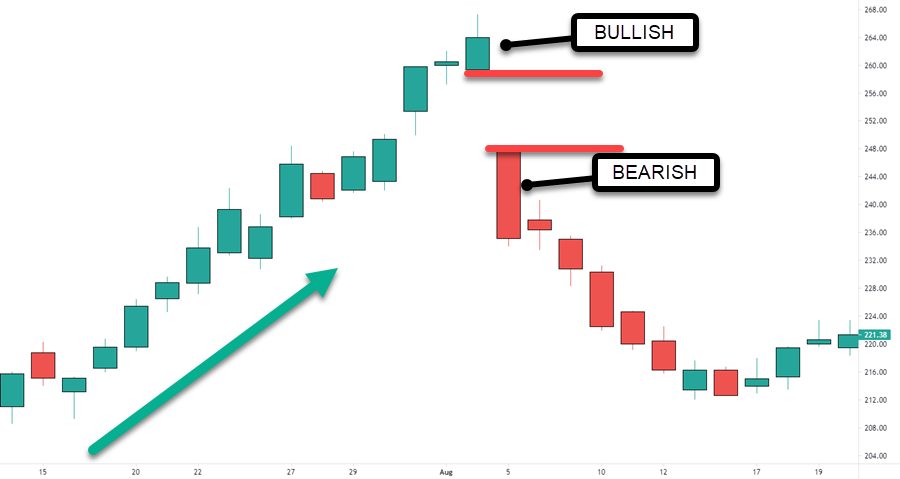
What Is A Bearish Kicker?
-
- Starts during an up trending market
- A large momentum style green candle plots (preferred but not a definite requirement) – a bullish candlestick in the direction of the overall trend
- The next candle essentially gaps lower and is red with little no lower shadow – a bearish candlestick
This is a daily stock chart of Arista Networks and what we are essentially seeing is a gap down in price while price is in an up trend
An important note is there is no overlap of the two candlesticks and no attempt for the red candle to seek out a higher price point. The red candle almost closed on the low of the day.
Psychology Behind The Bearish Kicking Pattern
Any large move in price can shock a trader. If we think of large green momentum style candles, we know that those will draw in more buyers further driving the price. They fear missing out on a big run.
Same with this pattern.
Imagine you are long in the above example or sitting on the sidelines to short this stock.
- If you are long and the kicking pattern steps in, you will immediately see loss of profits
- This strong move down will cause traders to exit their positions
- If you are looking to short, this candlestick pattern is a strong sign of bearish intent
Understanding the thoughts going through a traders mind will tip you on the trading approach.
How To Trade The Bearish Kicker
So we understand that this is a bearish sign and when traders don’t see any price attempt higher, they will unload during the session.
You will want to use a lower time frame chart for an entry and depending on how price evolves, you could short the rally or trade a break of a trading range.
In this instance, we are using the daily chart to:
- See the kicker at the open
- Understanding what the pattern means
- Seeing the bias for the day
- Using a price pattern such as a trading range break or a pullback to enter a trade
Instead of using the kicker as information only, we can also trade it by itself.
This is a 5 minute stock chart and at the open, we actually get a gap up in price.
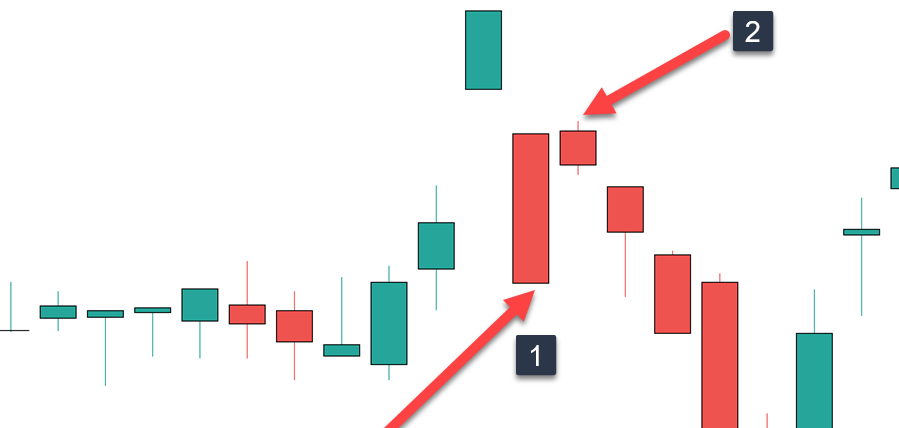
In this example, we will see two possible ways to trade it depending on what price does:
-
- Selling a break of the low is a viable approach and this example had a $1.15 price drop to lows
- Price tries to fill the gap and we get a higher high which means at one point, this candle was green. Once it turns red, traders could enter a position in what is called a momentum shift. Once you sell, your stop goes just above the high. This increased your profit potential to $2.09 with only a few cents stop.
Having a few techniques to trade this pattern is important because we never know what shape price will form after the kicker becomes confirmed.
Will we get a pullback we can trade? Will price pause to give us an entry?
We never know until it happens.
Bullish Kicking Pattern Explained
We are looking at the exact opposite of the bearish pattern:
- Our first candlestick will be red in the direction of a down trend
- The next candle will open above the red candlestick and be green
Let’s take a look…..
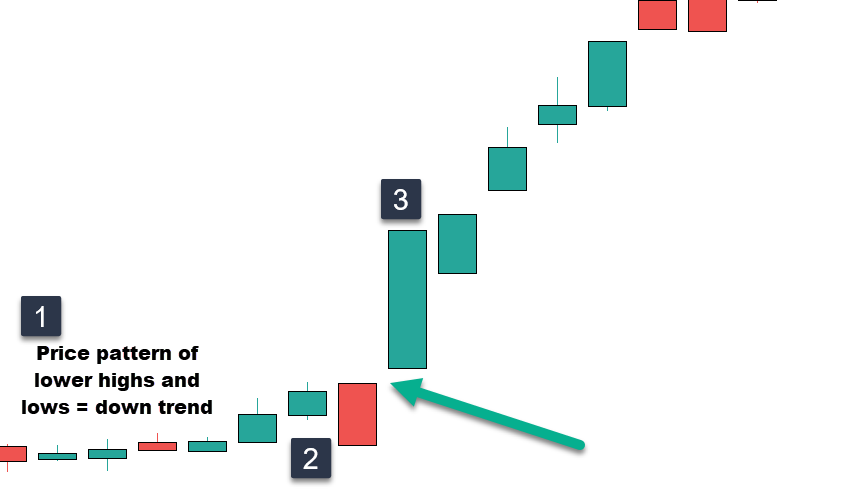
This is a 5 minute chart of the stock F5 Network.
-
- We are in an down trend as defined by the price structure of lower highs and lower lows
- Price closes red on the day
- The first 5 minutes of the open, we go green, two candles not touching and our bullish kicking pattern is in force
Notice on both the red and green candlesticks there are no shadows present.
Trading The Bullish Kicker
We are looking to do the exact opposite as the bearish pattern. Keep in mind this is a 5 minute chart, you could drop lower to find a price pattern like we talked about earlier.
A simpler version is to buy the break of the high of the completion of the kicking pattern.
These are not complicated plays but we must ensure we have a price point where will exit if price does collapse.
Profit Targets And Stop Loss
Unlike some chart patterns, the kicking patterns don’t have built it guidelines for targets such as measurements of impulse legs or height of price ranges.
There are two rules of thumb you can use for stops if they fit your risk protocols:
-
- Look to exit at a loss if current price breaks 50% of the range of the previous candlestick
- Use the low of the entry candle or low of second candle in the kicker
Profit targets are personal preference and you have to know what type of trader you are:
- Scalpers may exit at the first sign of red after a bullish kicker
- Risk reward targets may come into play where you will exit at 2 or 3 times your initial risk
- Trailing stops may be used either under each candlestick low in an up trend or using average true range.
Conclusion
The kicking pattern is a powerful reversal pattern that shows an obvious change in sentiment.
You can trade the pattern is several ways:
-
- Using the daily chart where the kicking pattern gives you the bias on lower time frame setups
- Using intra-day time frames where you trade the kicking pattern as the setup
The difference between the two is one if purely informational and the second is the tradable setup.
Nothing is guaranteed so ensure you have your risk protocols in place so your losing trades are unable to wipe your account out.