- July 27, 2021
- Posted by: Shane Daly
- Category: Trading Article

Traders that trade the reversal after a pullback often have a difficult time determining if an actually reversal has taken place.
There are methods such as candlestick patterns or even simple trend line breaks that show a change in the rhythm of the market.
Let’s consider another method.
The continuation strategy is all about:
- Letting the reversal take place
- Look for the continuation to reach a certain point
- Enter and ride your trade to two different levels
Who is it for?
Relaxed traders who don’t mind giving up some potential profits in order to get a more confirmed trade.
Who is it not for?
Traders who trade on the edge of their seats looking to pick exact bottoms and tops.
Continuation Trend Trading Strategy – Indicators/Time Frames
The only indicator you really need is the Fibonacci retracement tool.
We will use the following inputs on the Fibs:
- .786
- 1.272
- 1.618
Those who want an objective way to determine trend direction, a 50 period EMA can also be included.
We will also be aware of the swing high and low points that can become support or resistance levels to approaching price.
As for time frames, I prefer daily chart setups for most of my trading. If you want more action, feel free to experiment on any time frame you choose. The concepts will be the exact same as they would be on a daily chart, weekly chart, all the way to a five minute.
Trading Strategy Explained
The plan behind this strategy is to wait until price travels to the .786 level of the recent swing. This is a little different than the traditional use of the Fib retracement tool.

The traditional use on the first swing up on the left is:
- Pull a Fib retracement from 1 to the high at 2
- Look for price to retrace into the area marked 3 (or any other level you have drawn)
For this strategy we will:
- Let price begin to retrace
- Pull our Fib from A to the low of B
- Look for levels .786, 1.272, 1.618
What are these levels used for?
- .786 will give us our entry price. If the low at B for an uptrend gets lower, redraw the Fib lines
- 1.272 is our first profit target or trade management area
- 1.618 is our final target price
Traders will determine if they will trade in the direction of the trend or take advantage of each swing that presents itself. If you decide to take all trades, watch out for markets that are not making swing highs and lows or lower highs and lows.
Trading ranges will chop you up depending on how tight the trading range is.
If you enter at .786 and are stopped out immediately, as long as price does not hit the .786 level in the opposite direction, you can look to reenter.
Stock Trading Examples
For these examples, I am going to use the variation of taking obvious swings in the market meaning I am not concerned with the overall trend direction.
The basic selling rules:
- Look for a decline in price and then a rally
- Measure from the low point to the high point of the rally
- Look for price to break the .786 level for your entry
- If price fails to break the swing low, look to adjust your stop or exit
- Shoot for the 1.272 conservative target (1.618 on thrusting price action)
For the buying rules:
- Look for a rally and then a decline in price
- Measure from the high point of the decline to the low point
- Enter at the .786 level
- Monitor price at the swing high
- Shoot for the 1.272 conservative target (1.618 on thrusting price action)
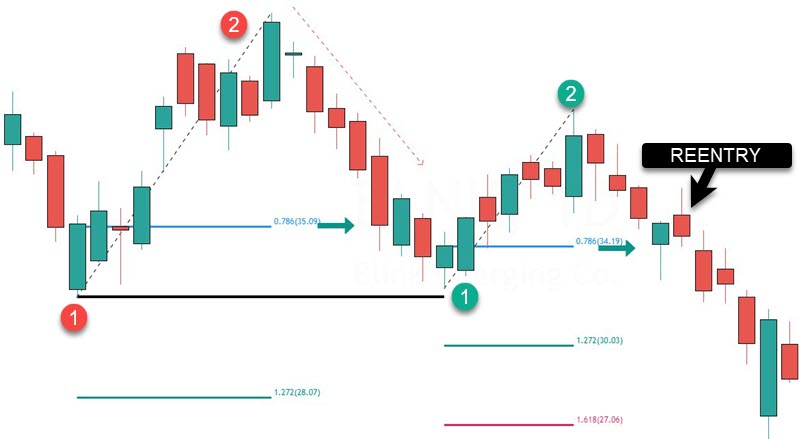
This is the daily chart of Blink and the different colors represents different trades.

On the left, the Fib tool pulls to measure the retrace from 1-2.
The .786 entry price is plotted with the green arrow. We would enter the trade and place the stop loss below the low of the candle that triggered at the .786 level.
We are looking for price to clear highs and it does not. We would immediately exit this trade. As price did travel roughly $2 from entry, most traders would have banked a small profit or a scratch trade. How you manage your trades can make a huge difference between any profits and a loss.
Second Trade
Using the green numbers, we pull from 1-2 which is the length of the price decline.
The green arrow shows us the trade entry and price eventually hits the main target of $44.57 for roughly a $4.80 per share profit.
Third Trade

On the first trade shown with the red numbers, 1-2 is the pull and the .786 is the entry price noted with an arrow.
Price stalls at the previous swing low and again, depending on how you manage the trade, you bank a small profit.
Fourth Trade
In green, we see price hit the entry and if your stop is above the entry candle, you get stopped out.
The reentry rules now apply: if price does not break the .786 in the opposite direction, enter again at the same price.
This trade hits both targets for a profit of roughly $7.20 per share depending on your trade management style.
Stop Loss Locations
This strategy is assuming that price will continue to advance so we want to make sure our stop reflects that.
We have two things to consider:
- Our original stop loss location
- Adjusted stop at highs or lows
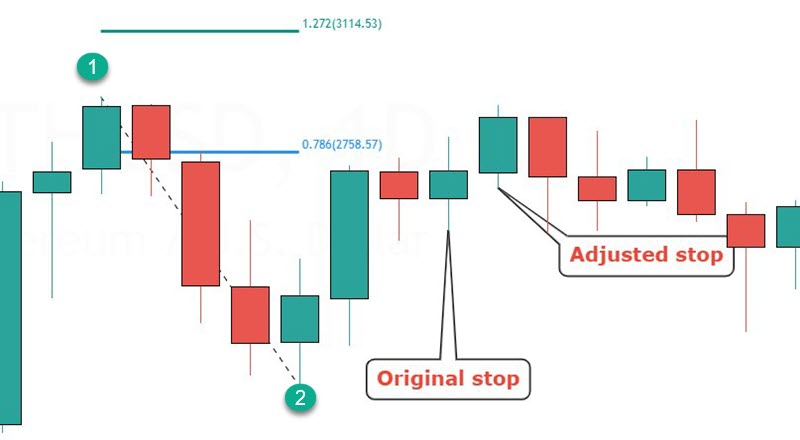
This is a Bitcoin chart and the green circles represents the Fib sequence.

The original stop is under the trigger candlestick that enters the trade.
We would want to adjust our stop under the candle this hits resistance in the case of a long. The thinking is that is the continuation is strong with, we should see very little hesitation at the swing high or low points.
The key point however is that the risk you are using fits your trading account. There is no sense in risking ten percent on a trade as it won’t take many losing trades before you’ve dug too deep of a hole.
Other Thoughts
At times, you will see many swing points. The best thing to do is to scrunch the chart up where you will only see the main swing points on the chart.
You may decide to enter at the original entry price (.786 level) and then add to your position as price breaks the swing high or lows that need to be taken out.
Another use of this strategy is to actually combine it with a reversal off the extreme of the pullback in price.
- Look for a retracement in price
- Trade a reversal pattern off of the extreme of the pullback
- Look to add to your position at the .786 level
- Manage your trade at support or resistance
- Look to use the price targets to scale out, adjust your stop, or take profits.
Can you add other trading indicators? Sure. Keep in mind that complexity does not always equal success.
Give this a try over several instruments. Let me know what you think in the comments below.
