- August 1, 2019
- Posted by: Shane Daly
- Category: Trading Article
Overthinking and subjectivity can be the downfall of many traders.
Searching too hard for a trade or having flexible rules for determining market state is not the road to disciplined and consistency in trading.
When I started trading, I had a tendency to over think many things. “If in doubt think it out” was something I strongly adhered to but in the end, it caused me to see things that were not truly there – like trend direction.
You have probably heard the saying “trade what you see, not what you think”. It contains a lot of truth and I would add the following to it:
“Trade what you can EASILY see….not what you think”.
That simply means that if something is not obvious on the chart, does not pop out and show itself, move on to another trading instrument or Forex pair. This is vital training for day trading so you don’t trade choppy markets.
While not a trading indicator junkie, it is true that sometimes the use of a trading indicator or two can help you bring simple to your trading especially for the “over thinkers” among us.
Trend Direction – What Is It?
Even something as simple as the direction of a trend can cause a headache to a trader. Even though you can see by the price pattern of higher highs and lows for an uptrend as an example, sometimes our brains want to find the less obvious.
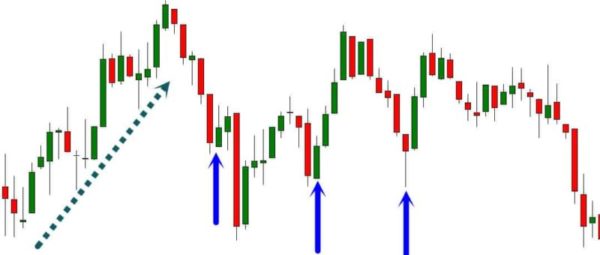
This chart here, when I started trading, I’d probably would have said this was a market in an uptrend due to the move on the left.
There is a stair stepping type of pattern that we want to see in a trend. The green bull candlesticks are bigger than the reds so I would attempt to buy into the pullbacks to get involved in what I thought was the overall trend.
The last hard red candlestick showing momentum to the downside was right into a previous swing low. This could have been thought of as an exhaustion thrust and more upside was in the cards.
You can see by the blue arrows that my longs would not have seen much in the way of profits. I may have even added to the second position when the third pullback occurred.
Remember that we trade the hard right edge of a chart and what may be obvious in hindsight, wasn’t during the actual trading event.
Price Action and Market Structure
I would have taken a loss because the filter I was looking through was not clear.
I was caught up in making huge profits trading the trend that I thought was in play, that I missed some obvious events that should have been a little more clear.
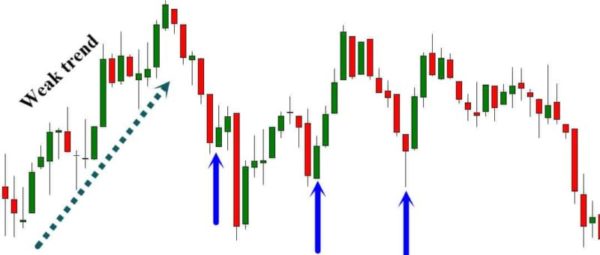
- While the stair step was in play, the momentum upside was not as strong as it appeared. Weakening trend?
- Doji candles showing indecision in the trend. If strong uptrend was in play, I should not see as many doji candlesticks as I had
- Upper shadows are a sign that the buyers were getting pushed back down by the sellers. The buyers were not fully in control.
- The pullback off the top was “strong” and at the very least, I should have stood aside to see what was occurring after. As well, I did not see a failure test of lows which is something I look for in my trading plan.
What else was I missing?
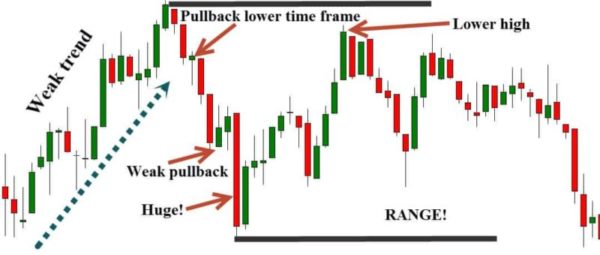
- There was also hidden pullback on a lower time frame chart shown by the first green candle after the high.
- Weak pullback showing very little buying pressure.
- Huge bear candle.
Price fails to make a higher high and effectively becomes a consolidated structure. Once a lower high is put in, my trading plan calls for potential range forming and to sit aside. Seeing how the chart was evolving, this should clue me into scaling out of a position or simply close the position until this structure resolves.
What I should not be thinking is to position myself into a long trade while in consolidation unless I am seeing a price action sign of one side taking control of the market.
There are ways to position yourself for a probable directional move out of the range but not only is that beyond the scope of this topic, it can be highly directional.
Trend Was In Trouble
If I would have understood that the trend was in trouble (it does turn into a full scale reversal), I could have saved losses and the commission costs of trading. Not only that, it could have allowed me to take advantage of trading setups on the lower time frame because I understood the state of the higher time frame.
Often times the market can give you conflicting signs and if you guess wrong, it can cost you money. Attempting to trade in a choppy market state should only be undertaken by skilled traders.
Trading in the direction of a strong trend, even if the setup is not crystal clear, gives you better odds of making a profit. Trading the wrong direction or attempting trend trades in ranging markets, is a bad move.
Having an unbiased and objective opinion on the trend and current market state can be considered Step 1 in finding good trades and sometimes a trading indicator is called for.
How Is This For Clarity of Trend?
This is a weekly Forex chart giving you an objective determination of trend direction.
You can see where, on the lower time frames such as Daily, you would switch gears and look for appropriate entries according to your trade plan.
It takes all subjectivity and personal bias out of the equation and tells you: Trade in the appropriate direction.
If you trade many currency pairs especially using the four hour time frame, it can be time consuming switching from the trend chart to the setup chart.
Higher Time Frame Trend – Lower Time Frame Trades
This indicator on the bottom actually shows you the weekly trend while looking at the four hour chart. You can clearly see where you would switch from a long bias to a short bias.
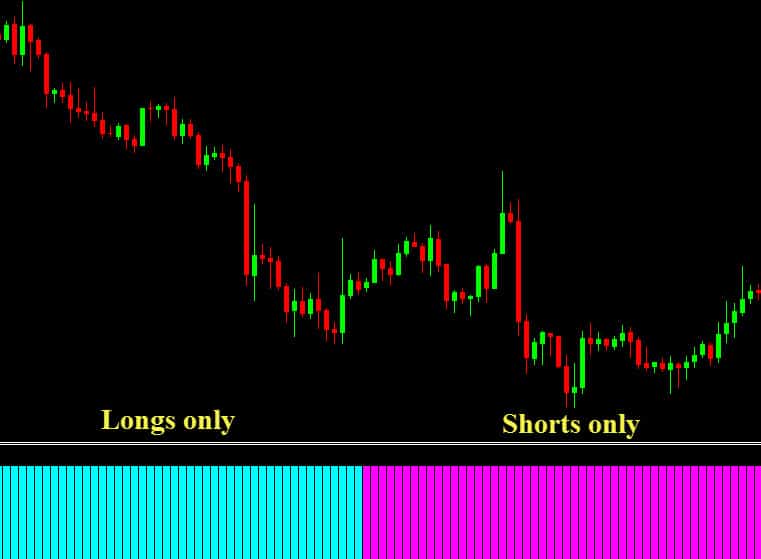
If you saw the indicator switching back and forth between colors too often, you could quickly determine the market is not in the best trading condition and sit aside. Fast trend changes on a higher time frame can have you whipped back and forth on smaller time frames.
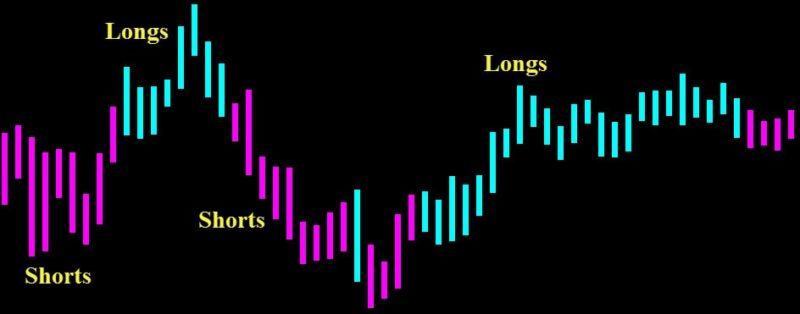
Soon after the indicator tells you objectively to take short trades as shown in the above chart, we have a complex pullback using A to B = C to D and then a reversal set up to get you into the play.
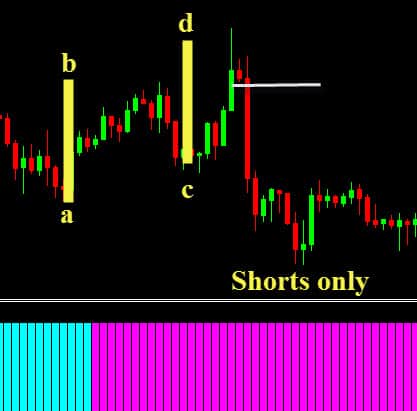
A quick glance at the chart showed what direction the higher probability trades are in.
To a vast number of traders, this is the type of trading indicator they need to keep them on the right side of the market and away from guesswork and knee jerk trading.
You could even use another trend indicator such as this alongside a trading strategy like the Alligator Indicator strategy. Instead of using the golden cross trend direction, you could use this as well.
Keep in mind that if you use a MT4 range bars indicator, all indicators will calculate differently.
Dynamic Profit Detector Download
We want to help traders succeed at trading and Netpicks has decided that instead of selling this trading indicator, we could help more traders have a fighting chance of surviving the crucial first few months (for some, years) by simply giving it away.
No strings. Nothing to pay. Just enter your email and download the indicator. You will also have access to complete installation instructions including training videos so you can get maximum use of this outstanding trading tool.
I can’t say that knowing the trend direction will save your trading career, but it will certainly help you avoid the mistakes I made on the charts I have shown above.