- March 1, 2020
- Posted by: Shane Daly
- Categories: Day Trading, Trading Article

Technical indicators are part and parcel of the world of trading and are here to stay.
Unfortunately, it’s all too common to find that the indicator that you thought would work really well as either an entry trigger or filter, starts to let you down. You thought you had found the most accurate technical indicator available.
Whilst we’d all love to have a foolproof way to tell us when the best time to take a trade (or exit one) might be, over the long run this is a tough thing to achieve on its own.
However, with a bit of thought it is possible to boost the accuracy of any trading indicator.
How Do Trading Indicators Work
Before we get to how to pinpoint when your indicator is likely to be giving you a reliable read on the market, it’s necessary to consider the origins of indicators. What makes up all technical indicators is fundamentally the same – they are derived from a combination of price, time and volume from trades which have already occurred.
What this means is that whether your indicator is “leading” or “lagging”, it is based on what has already taken place and we all know that irrespective of what has already happened, going forward, anything can happen.
What About Price Action?
You can virtually guarantee that any technical indicator you are likely to use, will take no account of price action. So it will disregard technical price levels, where and how important swings are formed, current market behavior and also whether or not there’s an important market-moving event due out.
Indicators indicate without prejudice. It’s the job of a trader to frame what the indicator is saying in the current context of the auction process.
Price risk versus information risk
The whole point of understanding price risk versus information risk is that timing is crucial.
You might be able to identify a good technical level but get in before seeing whether the market has the strength to push through it or not. You might recognize the signs that the market is behaving a certain way (such as turning or continuing) but only when price has already moved way beyond what would give you a reasonable price in order to enter with an acceptable amount of risk.
Great Signals. Bad Price Level.
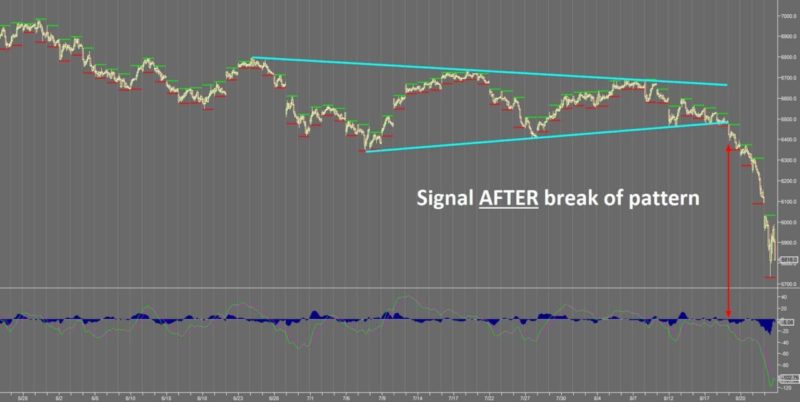
The trouble with many technical indicators is that they can give good signals at poor prices. Think about an overbought stochastic for example. Price might eventually turn, but it could be long after the original signal and many prices higher.
It’s true that you could wait for it to start to turn lower, but there is nothing to stop the market causing the indicator to fluctuate enough to make a trader think it’s beginning to turn. You could also wait for a greater reversal in the indicator for additional confirmation, but then price is also likely to have moved further in your theoretical trade’s direction and therefore elevate price risk as well.
Boost the Accuracy of any Trading Indicator
Technical indicators do suggest what’s happening, but the propensity for false or premature signals is high, especially when you consider how the market could be operating on a variable time frame depending on who is currently dominant.
Sometimes moves are faster and sometimes they are slower, so any indicator confined to a chart of fixed time frame (time, volume, trade or price-based – basically any chart) may or may not be in sync with the current market undulations.
So an understanding of price action, what type of phase the market is current in (balanced/ranging or imbalanced/directional at the base level) and increasing the time frame you look at to look for these clues, can make a big difference to whether an indicator being used as a signal or filter is likely to work for you at any given moment.
Fitting the market story
Market context and price action is basically a story and a trader’s role is to follow the plot.
Looking for behavior that fits in with what the market has already done can help you to identify whether a signal is likely to be a good one or liable to be false.
For example, you might get a signal to go long after a breakout of a balance area or you might get a confirmation of a reversal if the market starts to turn from the extreme of a balance area.
On the other hand, taking a short right above a critical swing low just because your indicator is telling you to, is unlikely to be a rewarding tactic when applied over many similar situations, even if it works once or twice.

If you truly grasp the market story and are almost part of it, you’ll begin to see where and when your indicators are likely to be accurate.
An important point to note is that you must know what your indicator is used for. You wouldn’t use a sledgehammer to put up a picture hook for example. It might work, but over time you’ll probably find that it’s really not the right tool for the job.
So using the correct technical indicator is essential. This might mean using a Stochastic to look for signs that a market is turning or an indicator such as a Moving Average Convergence/Divergence (MACD) to help you confirm a directional market.
Increase your context time frame
Upping your context time frame (not your execution chart) to match bigger players can really help you to find some excellent opportunities.
The bigger the players are, the higher their time frame usually is.
So looking for clues on charts with a higher time frame than the one that you would normally execute in, can help you ensure a greater degree of significance when assessing market behavior.
Either way, moves that happen on a bigger time frame than your own will also be bigger and if you align yourself with these, it’s more likely that you’ll find an opportunities that are capable of hitting their targets.
A trend on a 233 tick chart may not be especially important and not last for very long. However, if you identify a trend occurring on a 60 min chart, it’s far more likely that you’ll be able to find a decent trade and one which has the potential to move an appreciable amount in your favor.
A note to make is that although you could try using a longer term chart for your indicators too, the danger is that you introduce too much price risk as the indicator is either way ahead or way behind your execution time frame.
Indicators indicate
First, we have to set them up and use them at the right moment and in the right context.
Using an anemometer to measure wind speed as a proxy for the speed of your car, instead of the speedometer which most cars are fitted with, might well be useful in a very small number of precise circumstances.
If it’s important to measure wind speed for some reason, then you have the right tool. However, in most cases it’s likely to be a waste of time and give you an inappropriate measure of your vehicle’s speed
The same can be true of indicators. If you use them wisely, they can be a powerful ally. If not, they can tie you in knots.
Recognition of the idea that what a market is doing, particularly in a time frame higher than the one in which you normally execute, can have a huge impact on whether or not an indicator makes any sense.
Bringing together these aspects of analysis doesn’t have to be the most difficult of tasks but does require a level of commitment to the ongoing process of following the unfolding market story. Use the right tools for the right job.

