- July 1, 2020
- Posted by: Shane Daly
- Category: Trading Article
Tick charts are different than time based charts in that your tick chart, will only plot when N amount of transactions have taken place.
For example, a hour candlestick will plot a new candlestick every 60 minutes regardless of the amount of transaction that have occurred.
A tick chart, using a 2000 tick chart as an example, will only print a new candlestick when the 2000th transaction has taken place. You can set the number of tick required to any number depending on the type of trader you are.
Why Use Tick Charts VS Time Charts
Traders that promote the use of tick charts find that the static nature of time is irrelevant to their trading. What is more important for them is how quickly the market is moving.
Reading tick charts is simple: each bar will plot depending on your setting which determines how many transactions have to take place.
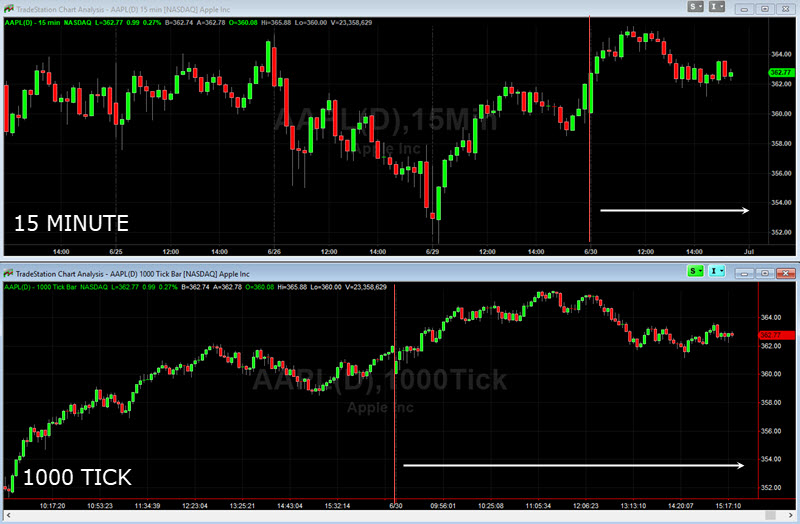
This is a stock chart of Apple comparing the 15 minute time based chart and the 1000 tick chart. The red line denotes the open and on the time based chart, the first 30 minutes has a run up in price.
Unless you were in that right at the open, there is no chance to get into the move. On the tick chart, we have a price range at the open that lasts for 12 minutes before price runs up. The price action on the tick chart gives you ample opportunity to make money to the upside.
Later in the day, while the time based chart ranges, the tick chart gives you trading opportunities inside that range.
From a trading opportunity view, the tick chart will give you greater chances of getting a trade off than the time based chart will.
Less Price Noise
A time based chart has to plot every N minutes which can lead to a chart that is messy. Price ranges are common and depending on the time setting, you’d be hard pressed to trade them.
Our tick chart can highlight the price movement that forms the time chart, and either print less candlesticks (or bars), or more depending on the market.
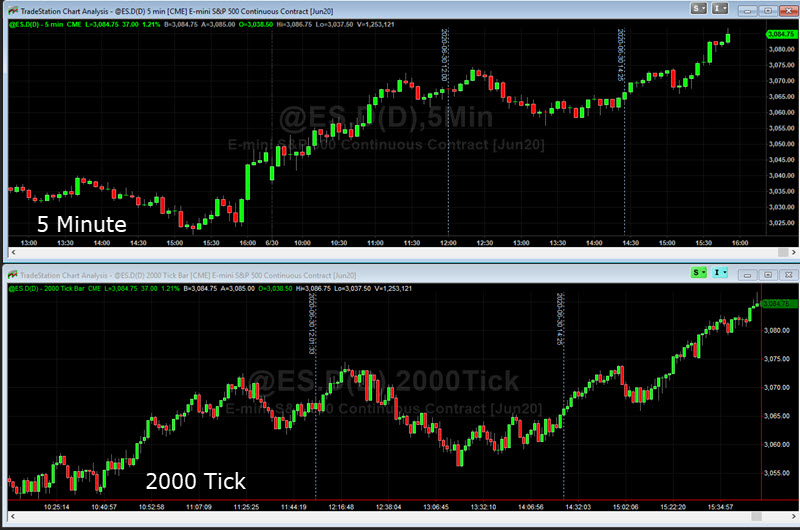
The vertical lines highlights the same time period. While the 5 minute day trading time based chart seems to drift down into a range, the tick chart gives pullbacks you can short on the way down. The range shows the price pattern of lower highs coming in which can give you an early warning of the breakout.
The time based chart has drifting and hard to trade price action.
Tick Charts + Volume Shows Bigger Money
Big money moves the market and due to the nature of tick charts, adding volume to the mix gives you a good look into when the big guns are stepping in.
This is the same chart as above but I have added volume to the charts. The red arrow highlights the same point in time.
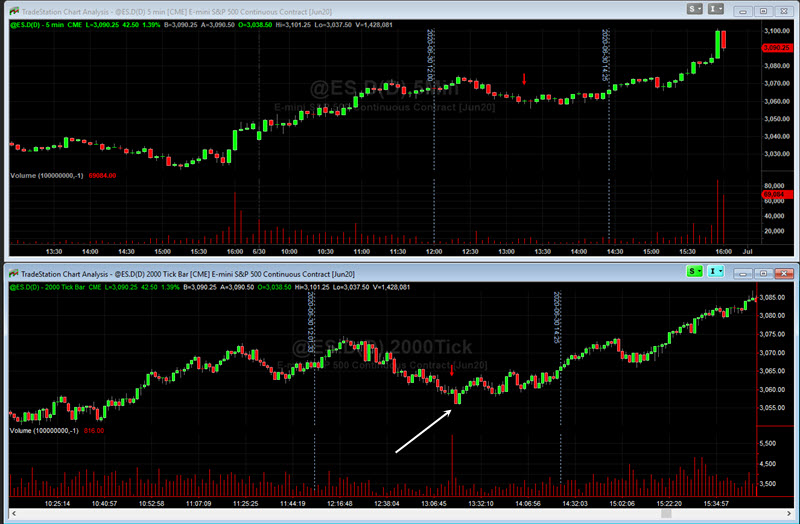
Big volume on the tick chart is actually a small green candlestick. There is not a big showing of volume on the top time based chart.
Even more importantly, the white arrow highlights a large red candlestick breaking out of the range. This would bring in breakout traders to the downside. But volume the candle before tipped the hand – this was a false breakout. Astute traders would have faded the breakout and as you can see on the next candle, price took back half of the red candle.
Early Entries
Tick charts use the same data as time based charts. You are seeing the same thing, price, but shown differently.
With time based charts, you need to wait N number of minutes before the bar closes. This can often times have you miss large moves or at least have you needing a bigger risk on the trade.
As you’ve seen in the above examples, the nature of tick charts gives you better price action trading setups, earlier signs of upcoming price movements, and in the end, more opportunity to make money.
What About Forex And Tick Charts
The issue with Forex is that there is no centralized exchange so real tick readings are impossible. I get it, many people only have enough capital to trade the spot Forex market and not actual futures.
There is nothing stopping you from using currency futures to chart the price movement and then using your spot account to place the trade.
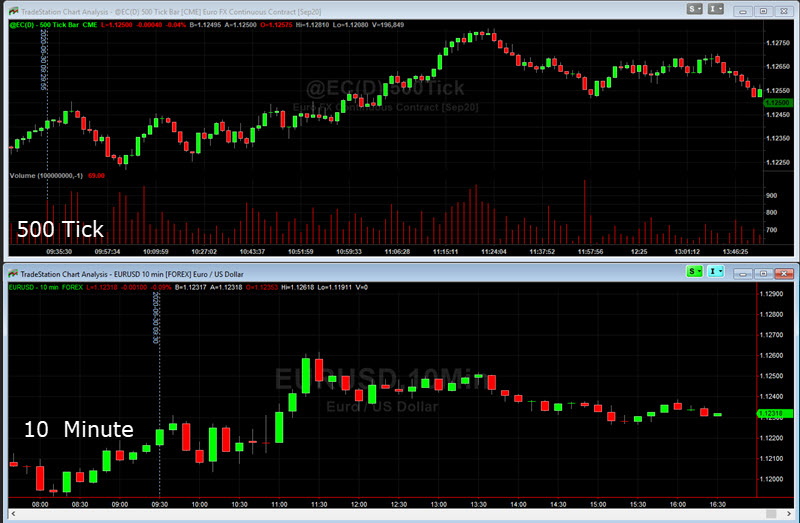
The tick chart, hands down, give you a much better view of the price action. The high of the day on the 10 minute time chart appears as momentum. However, if you look at the highs on the tick charts, we have increased volume without further price advancement. The time based chart would be a tough day trade scalp but plotting the tick chart, trading a support break at highs, gives 20 pips.
Remember in Forex, 20 pips, depending on your lot size, can be a small gain or a large gain. Don’t just consider the pips.
Last Tick Chart Thoughts
Tick charts are unique in that they will only plot when the desired number of transactions take place. Ultimatly, your choice of tick setting will be the deciding factor.
Consider in fast moving markets with plenty of volume, you’d want a higher setting such as 2000. Again, that depends on you but note that lower settings can equal extremely fast price moves that you are unable to trade.
Deciding on the tick number is hit and miss. Many traders simply use Fibonacci numbers to determine the setting: 233, 377, 610, 987…..
Multiple “tick” chart trading is possible. You can have a high tick chart setting for setups, 4500 for example, and dial into a lower tick setting 1000-1500 to determine entries.
Trading with price patterns is, in my opinion, easier with tick charts as the price movements are cleaner and easier to read.
The key, as is with all trading, is to test what you are doing. It makes no sense to not trust your trading style or system so ensure you can back up the “whys” behind your trading approach.
3 Comments
Comments are closed.
I know few people online who do very well cryptocurrency using a tick chart and volume profile. I’m new to this and was wondering if you have any courses n using tick charts besides this video ? Thanks
Regards,
David
Hi David. No, there is no course here for using tick charts. Odd take with trading crypto using volume profile. There is no centralized exchange for crypto trading which would make the volume read, inaccurate.
Thank you coach… Mr. Shane