- June 2, 2020
- Posted by: Shane Daly
- Category: Trading Article
The Klinger Volume Oscillator [KVO] is a trading indicator that uses both price and volume to highlight potential longer term trend turning points in the markets.
You should know that many people are referring to this oscillator as a leading indicator.
It is not.
It needs present price and present volume readings in order to plot.
What Is The Klinger Oscillator
This indicator was brought to the trading community by Stephen Klinger, and measures the trend of the money flow based on volume and price movement.
While it was designed to measure the longer term money flow trend, it can also highlight shorter term fluctuations. While that may sound confusing, a simple version of the Klinger calculation is better explained the following way:
- Volume moves through the market on every period
- Price movement, no matter how small is taken into account
- Klinger Oscillator uses the low price, high price, and the closing price
- Calculation is made using price and volume and is called volume force [VF]
- We then get an oscillator that is derived from the VF slow 55 EMA and fast 34 EMA [plus a 13 EMA signal line]
You don’t need to calculate it yourself but it is good to know how your indicator calculates the output.
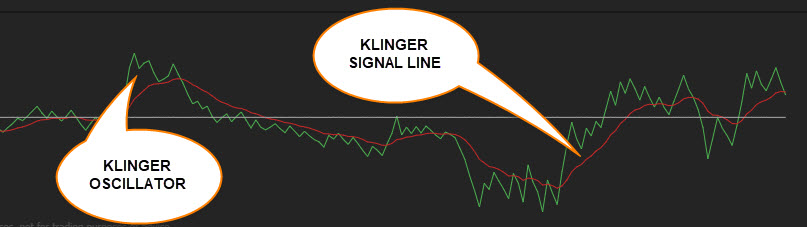
It does resemble the fast stochastic oscillator setting due to the choppy look of the signal line and is often used the same way.
If you want the complete Klinger oscillator formula, you can find it on the web.
How Is The Klinger Oscillator Used?
There are three main ways traders will use the KVO to trade the markets:
- Trend direction
- Buy and sell trading signals
- Bullish and bearish divergence
Trend Direction
When the Klinger Oscillator is used for trend, there is two ways you can do this.
- The first method is to wait until the KVO indicator line, not the signal line, crosses over the zero line
- Traders can also use a crossing of the signal line through the KVO line as a sign for direction. This is a little more aggressive.
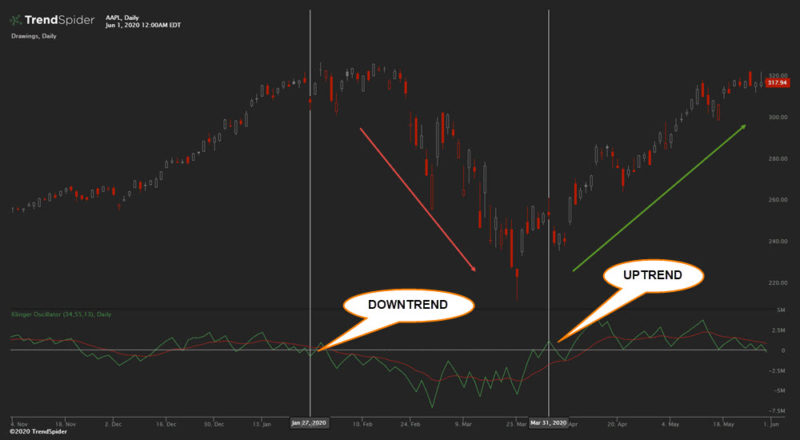
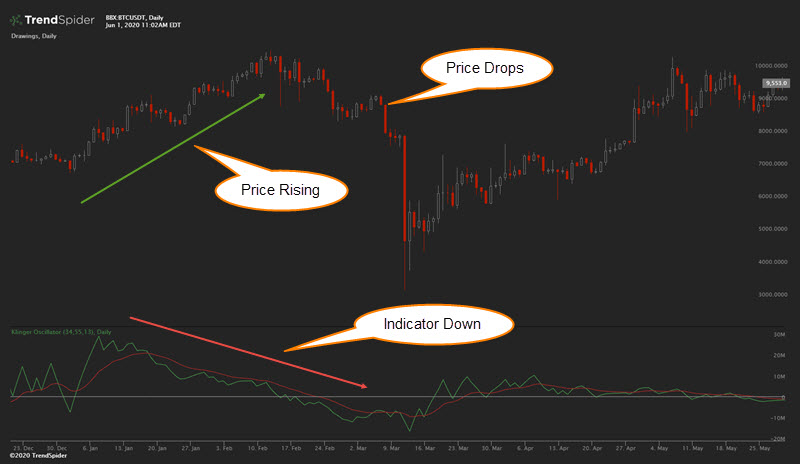
Here we are using a crossing of the zero line to indicate both down trend and up trending stock of AAPL [Apple].
Traders would consider only long or short trades depending on the KVO line relationship with the zero line. Aggressive traders may buy or sell when the trend changes keeping their strategy objective and mechanical.
What about changing trend direction with a simple moving average line crossover?
Let’s use the same AAPL stock chart to compare the two methods.
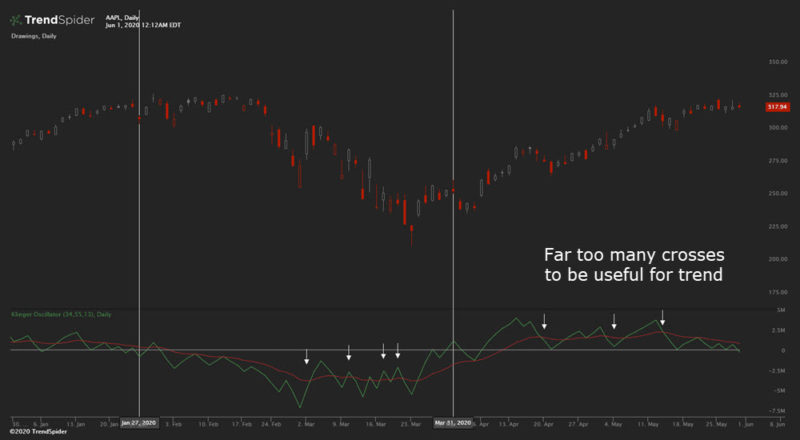
There are too many crosses of the averages to use that as our means of trend direction. Remember, the Klinger Oscillator provides traders with a longer term trend direction view. Using the crossover defeats that purpose.
Buy and Sell Trading Signals
When using the indicator for actual trading signals, we are going to use the signal line much the same way we’d trade moving average convergence divergence (MACD) crosses.
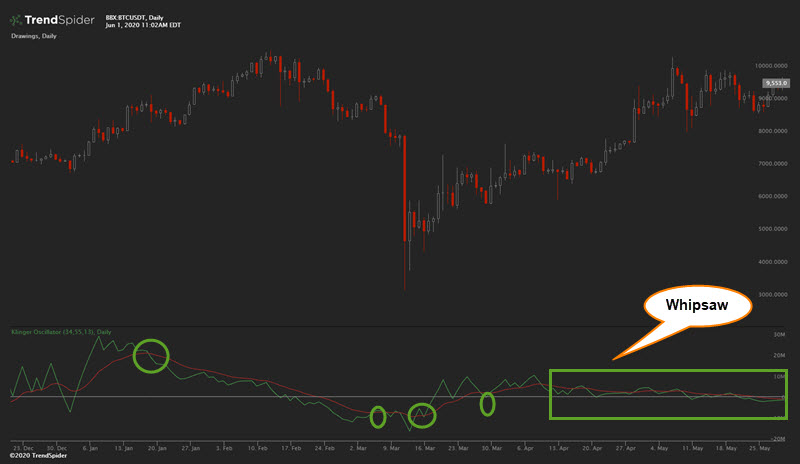
If you traded every crossover, you can see that you are in draw down and caught in whipsaw. This is not the way to use the KVO as a strategy.
For the data driven reader, I ran an un-optimized back test on 404 daily candles using enter at next open longs only on this particular instrument:
- Net Profit 16.65%
- Asset Performance 77.87% (buy and hold)
- Positions 32
- Wins 44% (14)
- Max Drawdown -24.08%
- Average Win 6.83%
- Average Loss -3.97%
- Average Return 0.76%
Designing a trading strategy using Klinger Volume Oscillator requires more than just the crossover trade.
Klinger Divergence Trading
Divergence is essentially technical indicators showing one direction and price doing another.
In this chart, we see the price chart heading upwards while the Klinger indicator has crossed the signal line and heading towards zero. This would be bearish divergence. Bullish divergence is the opposite:
I’d use the divergence as a warning sign and not a trade setup. You can be on alert for price action which includes the break of trending structure (higher highs and higher lows)
Adding Other Trading Indicators To KVO
You do have the option of using another indicator to aid you in trading with the KVO.
Keep in mind that it is an oscillator and in a broad sense, a momentum indicator. You do not want to add another indicator that works relatively the same.
So what can you use?
Trend line Breaks + Breakout Pullbacks
First thing you need is to ensure you have trendline drawing rules you can repeat. For me, I need to be able to connect the last swing into a high for a valid trend line.
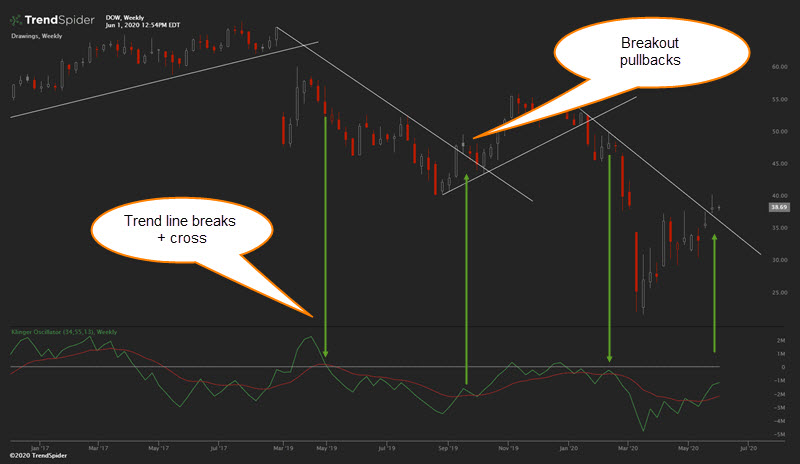
Traders can look for breaks of trend lines that coincide with the crossing of the KVO and signal line and trade the breakout.
For a conservative approach with some confirmation, you can look for a breakout and then a pullback in price as well as the indicator. You can see several of those on this chart.
You would trade these as you would with any pullback trading strategy.
2 Moving Averages And Klinger
Moving averages do not provide support and resistance but do give traders a zone of trading opportunity to watch for.
In this example, we are using a 8 EMA and 20 EMA + KVO for an intraday strategy.
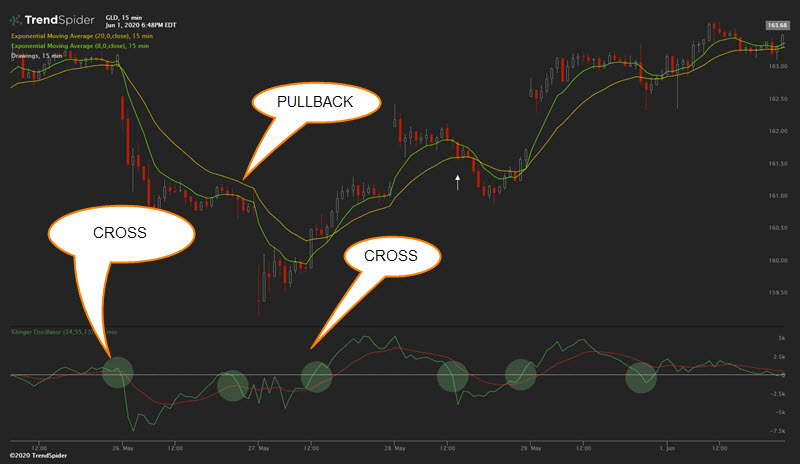
Consider breakout trades when price breaks through both averages with the oscillator crosses zero line
Pullback trades can be taken when price:
- Pulls back to the moving averages
- Trigger is a cross of the KVO through the signal line
- More aggressive trigger is a hook of the KVO
As you test these suggestions out, you still need to have exit criteria as well as proper risk/trade management
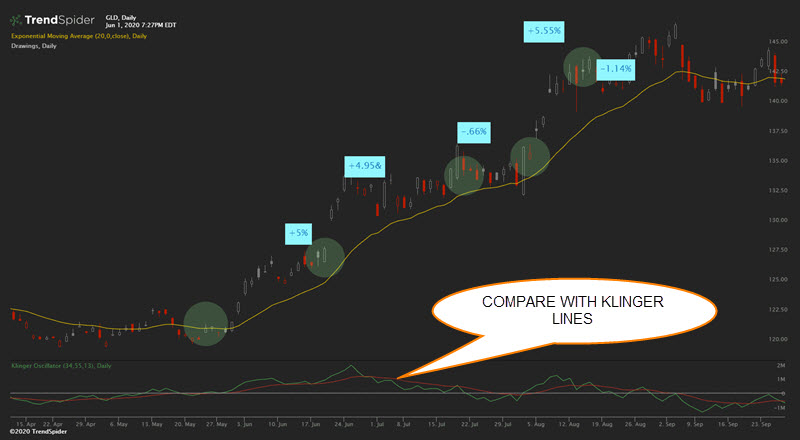
Moving Average Simplified
Here is another approach that tested out well for long trades in Gold SPDR.
The trading rules:
- KVO has crossed over the signal line
- KVO is above the zero line
- Price close is above 20 period EMA
- Enter by next open
- Exit is crossing down of KVO through the zero line
You will want to determine how you will identify range bound markets. One method is to watch when price is whipping back and forth through the 20 EMA.
Over 8 years of data, the results are not too bad:
- Net Profit 32.47%
- Asset Performance 7.16%
- Positions 80
- Wins 50% (40)
- Max Drawdown -7.90%
- Average Win 1.58%
- Average Loss -0.84%
- Average Return 0.37%
This is a jumping off point for traders to investigate a trading plan for themselves.
Conclusion
If you market does not have volume such as FX, unless it’s currency futures, you can’t use this indicator. It needs volume and regardless of your platform, true FX data is not possible due to no centralized exchange.
- You can use the KVO line for trend and the signal line for possible trade entries
- Adding another oscillator is redundant
- Using price action and or trend lines is worth investigating.
- Learning how to read the Klinger Volume Oscillator is not difficult
- If you are trading Klinger Oscillator on mt4, you can find it here
It’s an interesting indicator and adding volume into the mix along with price movement, does have a sound basis for a trading strategy.