- October 21, 2020
- Posted by: Shane Daly
- Category: Trading Article
Trading divergence involves the use of price action and technical trading indicators to find potential turning points in the market. From Forex trading to futures, trading divergence is a popular method of trading.
Finding a divergence is not a guarantee that a shift in price is going to happen but combined with other information, can be a decision-maker for a trader.
What Is Divergence In Trading?
Divergence is when the price and your trading indicator are going in the opposite direction.
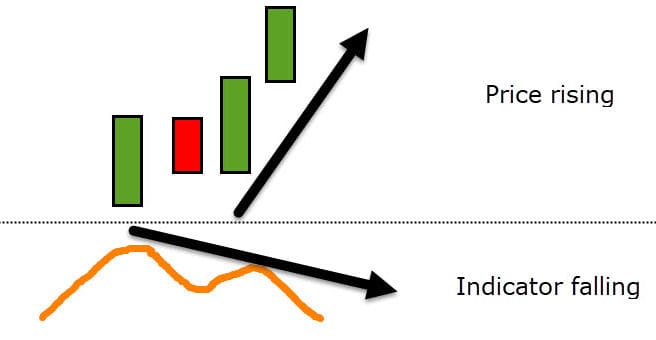
There are two main types of regular divergence:
Bearish divergence:
Price momentum is moving upwards with new higher high but a momentum indicator (MACD, RSI, Momentum) is moving to the downside. Seeing bearish divergence should have you at least considering a downside price move
Bullish divergence:
You will see a momentum indicator moving upwards while the price is still heading to the downside. Those with short positions may want to manage the trade while others may look for a trading position to the upside.
What Technical Indicator To Use For Divergence Trading
There are three main trading indicators that traders will use when using a trading system for regular divergence: MACD (moving average convergence divergence), RSI (relative strength index), and the Stochastic Oscillator.
MACD Indicator
When using the MACD, I prefer to use a modified version called the 3/10 oscillator. Here is a graphic of the settings I use for this modified MACD which makes it more sensitive to price action.

This would be a good setting for swing traders who are just looking to take advantage of one clean swing in the market. It also makes it much easier to spot the diverging momentum.
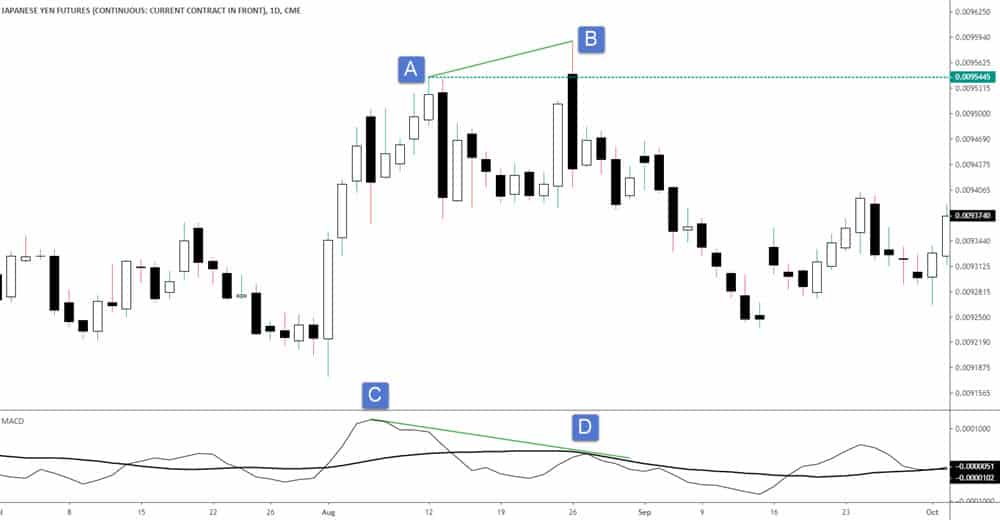
We are essentially comparing the peaks of the fast line and the peaks of the price.
On this futures chart, from A-B we can see price make a higher high. The MACD made lower highs from C-D. This indicates a market losing momentum or a bearish divergence pattern.
The opposite would be bullish divergence where price makes a lower low yet the MACD makes a higher low. Price eventually dropped 5% from highs to the lows off the right side of the chart.
RSI Indicator For Divergence
The relative strength index is another tool traders will use to spot a divergence in the market. You would use it, in the same manner, you would the MACD.
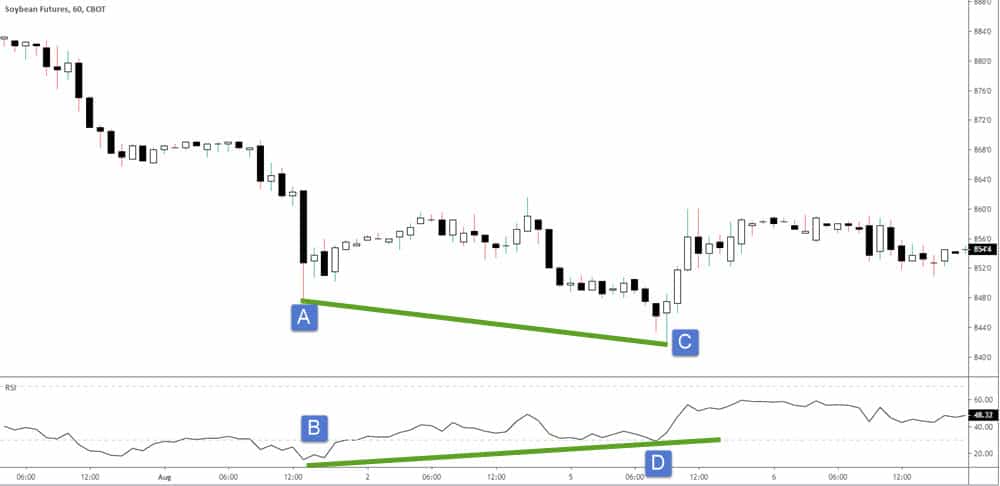
The RSI is set to 14 periods and in this example, we are looking at bullish divergence.
If you compare A and B, you can see both are making new lows. Over on the right, comparing C and D, price is making a lower low while the RSI is making a higher low. You would look for a trading position using your strategy for this bullish signal.
Using the Stochastic Oscillator
Wrapping up with the stochastic oscillator, keep in mind that you would use all the indicators in much the same way. For this example, the stochastics setting is 14,3,3
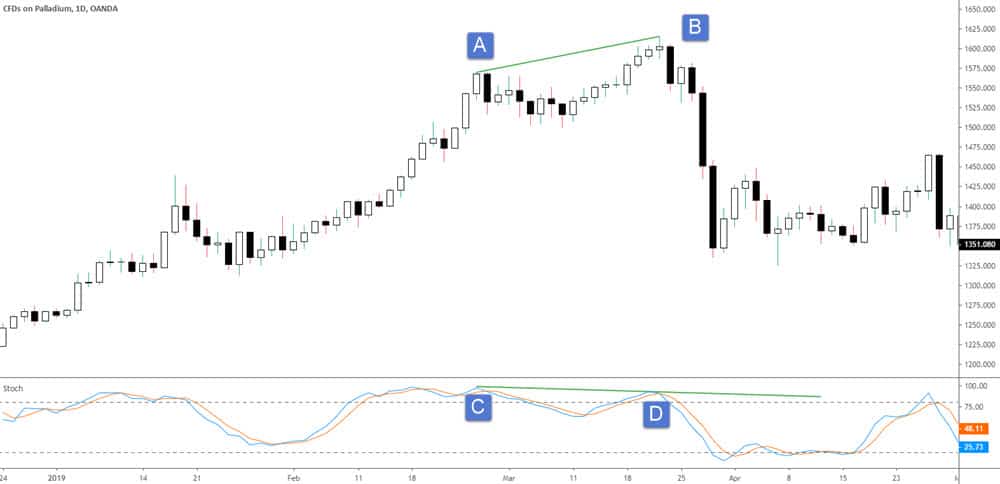
The price made a new high from A-B while the MACD made a lower high from C-D. Momentum came into the market and we saw a 17% drop in price.
Not all divergence setups will result in an adverse price move and some time we will see complete trend changes. Divergence is not always seen in price reversals and oftentimes price will transition into a range. You should consider other qualifications for a trade.
Trading Divergence Strategy
Keeping it simple, what does a divergence signal mean? A potential reversal in the current price trend. That’s it.
First thing is that we want to have some reason that price may be ready to reverse. Keeping that in mind, look for specific points in the market.
To have a strong reaction, we need to have those that are in a long position if we are looking for bearish divergence. Candlestick analysis where you look at the size of the candles can show if traders are still piling into longs.
What we want is to have these traders running for the exits once the new high fails to continue.
Look to have a trigger that when occurs, puts the odds in your favor of some time of movement in your direction and less false signals.
Trading Strategy Outline
- Keep your eye on points on the charts such as previous reversals and support/resistance zones
- Look for momentum in the first leg you are comparing to add to the probability of a strong reaction
- Use a trigger (trendline break, reversal candlestick patterns, multiple time frame pattern) to enter a divergence trade
This is a day trading time frame of Platinum and let’s break down each stage of the trade.

- This line represents potential resistance and as you can see by the large candle and shadow on the left, we expect a reaction.
- Momentum is pushing the price higher and the MACD makes a high
- Price breaks the previous high, the MACD puts in a lower high and the trigger would be a break of the low of the candlestick that broke the high. This would be for a short trade.
Let’s look at another example.

- There is a congestion zone to the left of the chart as well as the double bottom showing support
- Momentum shows up, obvious due to the candlestick formations, into the break of support. Price makes lower low while MACD shows higher lows showing divergence occurring.
- Entry trigger as a break of the high for the candlestick that broke support.
Regular Divergence vs Hidden Divergence
Hidden divergence is one that happens during a trending price move signifying a trend continuation. The regular divergence hints to a reversal of the trend.
As an example of hidden bullish divergence:
- Price makes a higher high in a trend
- The indicator you are using makes a low
I pay no attention to hidden divergence because we only know a trend is continuing when it continues.
Stop Loss and Price Targets
Since we are looking for a reversal, putting our stop loss at the pivot point of the reversal plus a buffer makes sense. If the divergence is going to hold, we want price to move in our direction and not reverse soon after entry.
Price targets can be a multiple of your risk, a break of a larger trend line, price structure or use a trailing stop.
What Did We Cover?
- Divergence is a trend reversal signal that happens when the price goes in one direction while the indicator goes another
- We consider two types of divergences: bullish divergence when the price is moving down while the indicator is moving up. Opposite for bearish divergence
- We can use the MACD, Stochastic oscillator or the RSI as part of the trading strategy
- Look for this pattern as potential trading opportunities and use an entry trigger for your entry
1 Comment
Comments are closed.

There is no magic setting. I start with default settings and any changes are a result of backtesting.