- December 15, 2021
- Posted by: Shane Daly
- Category: Trading Article
One of my favorite trading indicators is the MACD – moving average convergence divergence.
It can be used as a momentum indicator and as a medium term trend indicator.
There is a complete MACD trading guide and I won’t go into too much detail on it here except to say:
- Fast line – measures distance between short and longer term moving average
- Slow line – is called the signal line and is a standard setting of 16 period moving average of the fast line
- Zero line – A reference line
- Histogram – Shows difference between fast and slow line
We are going to use the MACD to find divergence on a chart and look to enter a trade in the potentially new direction.
How To Measure Divergence
To put it simply, we find divergence by seeing a momentum indicator head in one direction, while price heads in the opposite direction.
You can use any indicator that measures momentum, including the Relative Strength Index. The indicator is not as vital as your understanding of what it is telling you.
These charts are all using the default MACD settings:
- 12 is the fast line
- 26 is the slow line
- 9 is smoothing
- We are using exponential moving averages (not all trading charts allow you to adjust settings)
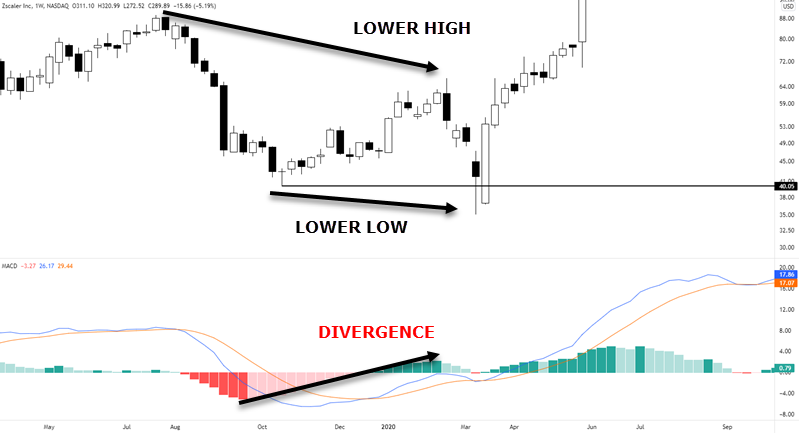
Price puts in a lower high and a lower low. That is the pattern for a downtrend. If we look at the MACD, we are seeing new highs being made both in the lines and histogram.
This is showing a change in the momentum of price to the upside. The reversal candle followed by momentum to the upside on the next candle confirms it.
When price is moving down but momentum is moving up, we call it bullish divergence.
This example is of bearish divergence.

Price is making new highs and new higher lows which is an uptrend.
The last push into highs is done with a full bodied candle which shows momentum in price.
However, looking at the MACD, we see bearish divergence setting up and is confirmed by lower prices.
Key Point: Divergence is a momentum indicator heading in a direction opposite to the direction of price.
Now that you understand what divergence looks like, let’s look at how we can use it alongside price action.
MACD Divergence Trading Strategy
Understand the idea behind what the strategy is:
- MACD is showing a momentum in current price direction failing
- Reversals of price in the direction of the change in momentum
This is a daily chart of Facebook. I am not cherry picking the best examples but want to make sure we cover a few different situations in price.

Price has put in a higher high while the MACD is showing weakness in upwards momentum.
This chart gives us a consolidation at highs that we can look to trade to the downside using a range trading strategy. You can mix and match anything in trading so don’t get stuck thinking there is only one way to trade something. With the range, we are hunting downside breaks with the support of bearish divergence.
Using an upsloping trend line, traders can look for price to break the trend line and find an entry in that location. In this example, after the break and gap down in price, we have a one day consolidation that a trader can position in.
Key point: Ensure you have trend line drawing rules that are repeatable.
This is a currency chart using the daily time frame.
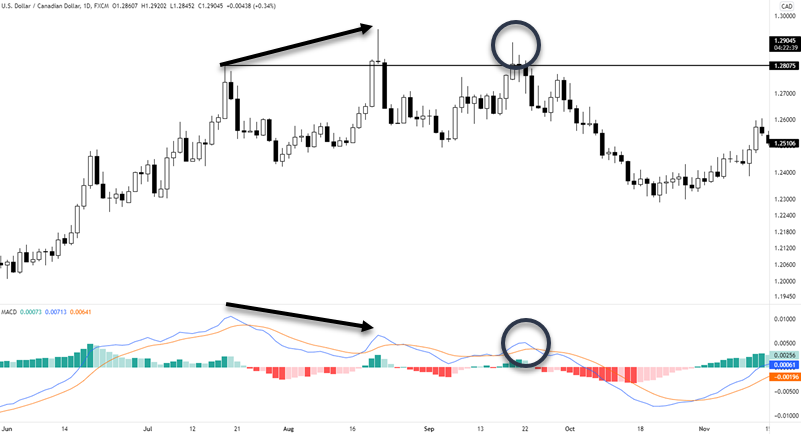
This chart set up a perfect reversal candlestick alongside bearish divergence.
There is a pullback in price noted with the circle and we actually get momentum confirmation to the downside in the MACD.
Key point: Candlestick reversals can be used as an entry into a divergence trade
Divergence is not an absolute
Divergence is a tool and does not always show up when a reversal in price occurs.
This is a day trading timeframe of Silver Futures.
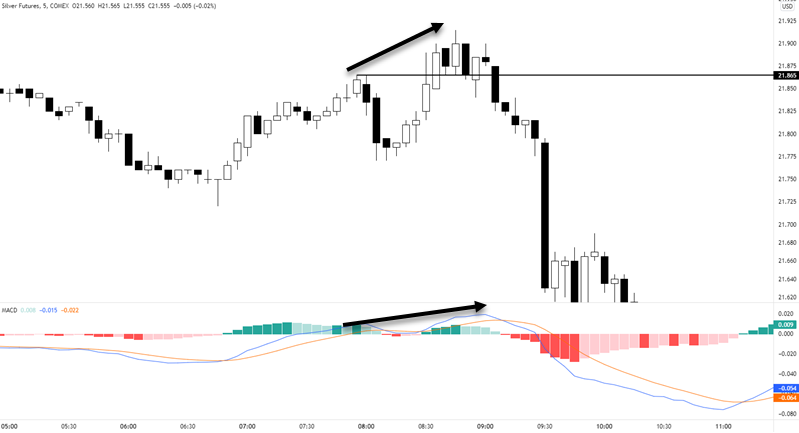
Price makes a higher high and the MACD continues to head upwards. A trader only looking for a divergence setup would have missed this down move.
While not the point of this article, this was actually a complex correction in a down trend that was a clear trading opportunity.

Targets and Stops
There are many ways to set your targets and stops and there are plenty of examples on our site.
This is United Airlines stock chart.
With this chart, we see higher price highs but equal highs in the MACD.
The fact that MACD could not make new momentum highs is treated as if divergence is setting up.

There are a few trade entry examples on this chart.
- Price has broken the previous swing high that can be considered short term resistance. If price breaks back below the zone as shown by the black horizontal line, traders can sell stop below the low of that candlestick.
- Price has continued to decline after bearish divergence and failure of highs occurred. We see an inside bar which is a lower time frame consolidation. Traders can play the break of that candlestick.
- The green line is an obvious swing level that could act as support. This is a good zone to adjust stop location, scale out partial position, or exit the trade.
Stop loss locations can be in tune with the actual setup.
What does that mean?
With divergence, we are going to have a pivot level in price because we are looking to trade at reversal points.
This is a five minute stock of Apple. For traders who have smaller accounts and can’t trade high priced stocks like this, consider looking into trading options.
You can buy a put for this type of trade that has you controlling 100 shares of stock for a fraction of the price.
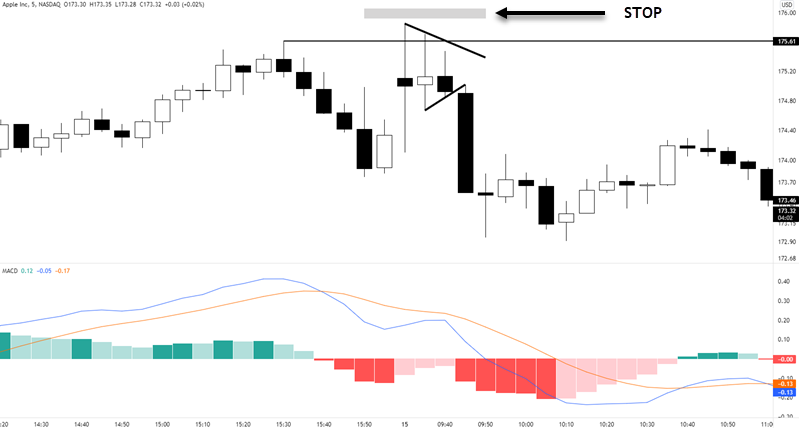
Divergence is in play and a three bar triangle has setup after higher prices were rejected.
Trading this short, your stop loss could go slightly above the high of the pivot. If this trade is going to fail, the failure would be a continuation to the upside. We want to be out of this position if/when that happens.
Key point: Consider placing stops where your reason for the trade would be invalidated.
MACD Divergence Strategy Conclusion
There are nuances with this and any strategy you are considering. Those can only be covered during your initial work on the strategy. You may add some discretion that I didn’t even consider which makes the strategy uniquely your own.
What is not a nuance are the absolutes that are needed for any strategy. For our divergence strategy:
- Price must make a new high or new low
- MACD must make a high or low in the opposite direction of the price movement
- We need a trigger into a trade and that is up to the individual trader
- Protective stop loss must be adhered to in order to prevent losses greater than 1R
- You need an exit for profits. From trailing stops to fixed targets, those are for the trader to decide
Divergence trading may open up new doors for you. Just remember that we trade price movement and not the indicator. The indicator should be supporting information to your trading decision.