- December 3, 2020
- Posted by: Shane Daly
- Category: Trading Article
Why do I think the 3 bar inside bar trading strategy by Johnan Prathap is worth looking at?
Because at its core, an inside bar is a triangle candle chart pattern (it won’t be perfect – think concept) and the third bar in this strategy is the break of that triangle.
Anybody that has ever traded a break of a triangle knows that the breaks can go quickly into profit. Even better, you catch the trend of an extended price move.
Let’s take a look at what an inside candle looks like:
There is some debate whether an inside bar can have its high, low, or both equal to the first candle.
For me, as long as it remains inside the high low range, it’s an inside bar and price is in consolidation Once price action moves one tick or pip outside the range, it’s no longer an inside bar.
However, once we have equal highs and lows, we have more of a trading range and less of a triangle setup. If that happens, I don’t expect the same reaction once the pattern breaks (we will cover the rules soon).
When we see an inside candle, a trader should see that there is a pause in the volatility of the directional price movement. It’s these pauses that we look to take advantage of.
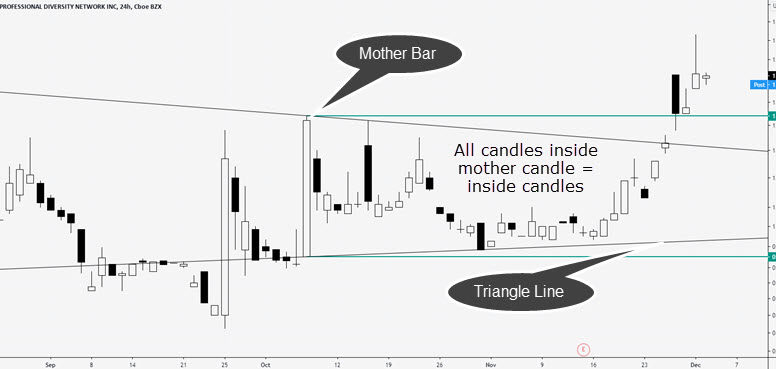 In this graphic, you can see a few things we’ve discussed:
- Inside bars resemble triangles on lower time frames
- You can have multiple inside bars inside one main bar
This stock eventually gapped up and over the top of the triangle and the top of the mother bar during the breakout. Once you see the rules, you will note that is not a trade we could take.
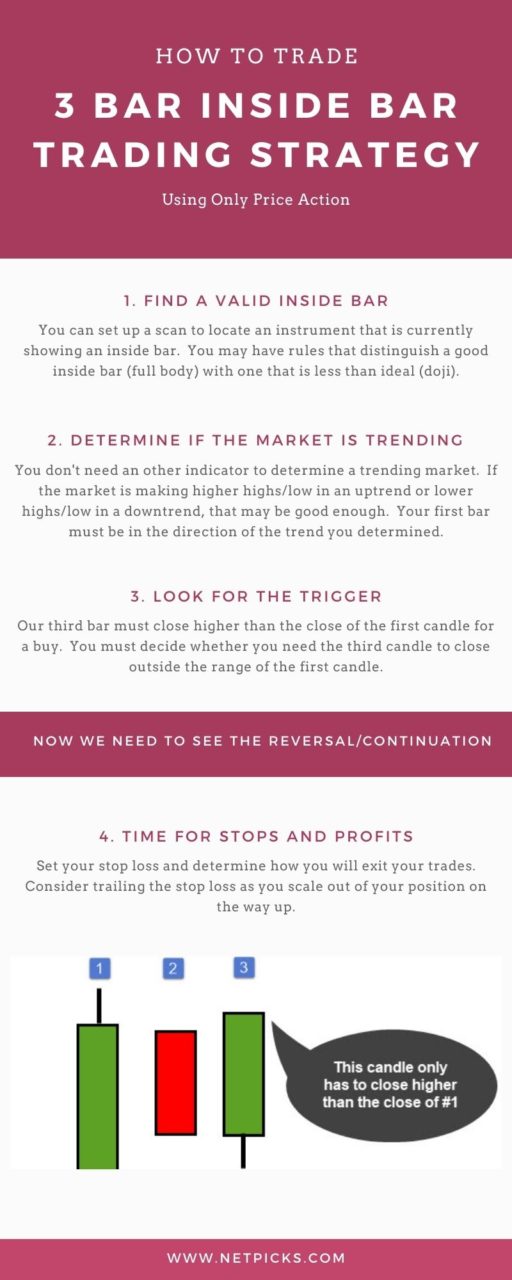
Trading Rules For The 3 Inside Bar Strategy
This strategy will take long and short trading positions otherwise known as positive and negative reversals. You can use time frames including a daily chart, weekly chart, even five minute intraday trading timeframes.
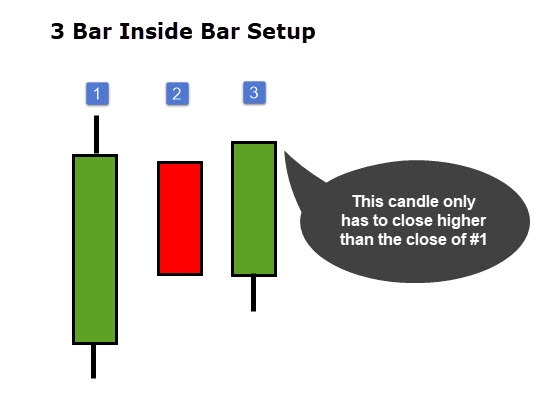
This graphic is an example of a completed three bar reversal.
The markets this was tested on by the designer of the strategy were gold, silver, and crude oil futures using daily data.
Buy Trades
- First bar closes up indicating buyers stepping in (or sellers unloading) and a possible trend upwards
- Second bar forms inside the entire range of the first bar becoming an inside bar – this is pretty much a pullback in price
- The third bar closes higher than the close of the first candle completing the reversal pattern. (Entry price is the closing price or close to)
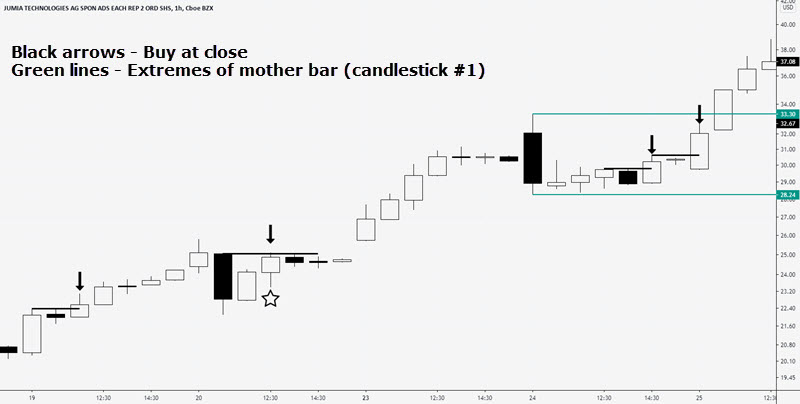
This is a one hour stock chart and there are several trading opportunities.
- Do we have a candlestick closing up to make candle number 1? Yes. Potential long setup.
- Do we have an inside candlestick formed? Yes.
- Does the third candle close higher than the first candle? Yes. We have a trade in a potential uptrend.
Drawing your attention to the trade with the star, this is where the details of the strategy matter.
The rule is that the third bar must close at a higher price than the first bar for a long trade. In fact, the actual rule is written as Close of bar 3 > Close of bar 1. Price does not have to break the high. If candle number 1 would have been green (close higher than the open), this would not be a trade as the close of 3 would be less than the close of 1.
On the right, those setups are inside the main mother bar. You have some choices to make:
- Would you still take those trades?
- Would you enter your trade after the breakout?
- Would you skip this sequence?
Whatever you choose, ensure you test it out and put it in your trading plan.
Sell Setup Rules
Sell rules are the opposite of the buy rules:
- First bar closes down
- The second bar closes inside the extremes of the first bar
- The third bars close is less than the close of the first bar
Let’s take a look at a four hour Forex chart.

This is not the best example because candle number one of the 3 bar inside bar strategy shows obvious signs of lower price rejection (reversal type of candlestick).
You must either define what you need the real body of bar number 1 to look like.
- Do you need small shadows?
- Can you have a long upper shadow for short trades? Opposite for longs?
- Can it be a doji?
We do have the inside candle and the third bar does close lower than the the first bar. Note that if you are using a rule where price has to make a new low that is lower than the first candle, it does do that here, barely.
You get zero momentum in your direction on this short trade before we start moving upwards. Every trading strategy will have losing trades.
Speaking Of Losing (and Winning)
We need a place to exit our trades in both profits and in losses.
What does the original strategy use?
“The system exits at a stop-loss of 0.75% or a profit target of 0.75%.
Not personally a fan of percentage based stop losses (or targets) because we never know how far a trade can run. Stops based on % will not take into account current market volatility.
My “go to” way of setting stops and targets is through the use of the average true range and trailing stops.
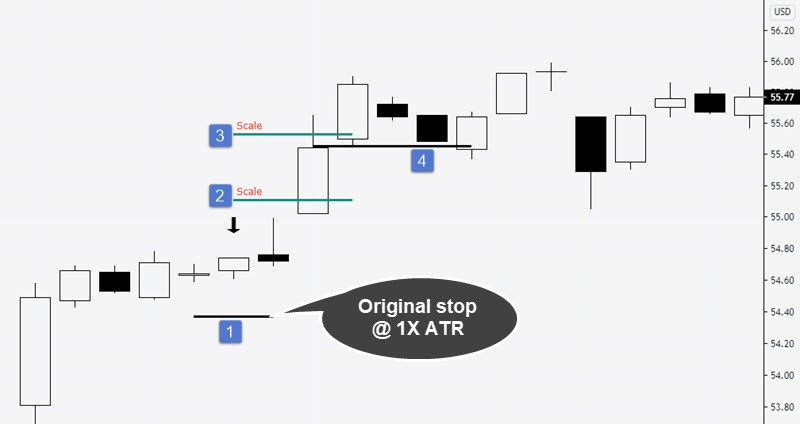
In this stock chart example, assume the ATR reading of 14 periods is .38 when we use a multiplier of 1 ATR.
We have a valid 3 bar inside bar setup:
- Our stop loss location is set at the closing price of the candlestick minus .38 cents.
- The first scale out is 1R or once the trade goes in our favor equal to the risk on the trade, we scale out 1/3
- This is our second scale at 2R or once the trade goes two times our risk
- During the up move, we used a trailing stop at 1X ATR minus the close to lock in profits. We are taken out of the remaining 1/3 at the solid black line
This is just one example that can be used with this strategy. Whatever you choose, just be consistent.
Conclusion
The three bar reversal uses an inside bar takes advantage of indecision in the market. Not only is it indecision, but on a lower time frame than your setup, you will see a pullback in price.
The signal begins to show up when you have an inside bar and that can be easily scanned for.
The reversal pattern is complete once the third candle takes out the close of the first candle.
Traders that are in profit on the original setup, may consider using further setups as continuation patterns. Once the reversal is complete, traders would add to their current position.
The biggest change I would make is to ensure you are looking at a trending market. Using a simple trend structure (higher highs and lows for example), can add to the success of each reversal especially in a smooth trending market.