- February 25, 2022
- Posted by: CoachShane
- Category: Trading Article

An inside bar and narrow range bars are examples of volatility contractions in the market. We can consider these a period of consolidation which would be more obvious if you dropped to a lower time frame once you find these bars. In the perfect world, we get volatility expansion from the coiling action of price leading to advances or declines in price.
In this article, we are going to focus on:
+ the fifth day being an inside bar and the most narrow range bar in five days
+ narrowest range bar in 7 days (NR7 pattern)
You can find tremendous trading opportunities with these setups.
Understanding Range Contractions
Markets move in both trending and consolidating movements. We have high volatility which is important to have to make money. Low volatility environments can be a painful time to trade. As markets move in strong directional patterns, there are times when we have a volatility contraction as the market “pauses” before price eventually makes a directional move.
 We look for continuation patterns in the market to get into the trending moves of the market. Traders want to take advantage when volatility increases to either be in a position or to allow a strong move to get them into a trade. In fact, depending on the chart pattern, you can almost predict which direction the signal will be.
 In these price patterns, you will see defined support levels and resistance levels. Price needs to break out from these areas to continue the trend. These can be volatile areas to trade around so risk management is paramount to your trade.
The takeaway here is that with the inside day N5 and the standalone narrow range 7, we are looking for volatility expansion from these patterns. Linda Bradford Raschke (although my take is from Tony Crabel – contraction/expansion principle) would refer to this as trend days followed by a period of contraction in the instrument.
While not a guarantee of a successful trade, it does give an edge when it forms part of a trading plan.
How To Trade The Narrow Range 5 (4) Inside Day
First thing first is to scan your instruments for the following conditions:
+ Current days range is the narrowest in the last 5 days
+ Current bar is also an inside bar (a bar completely engulfed by the previous bar)

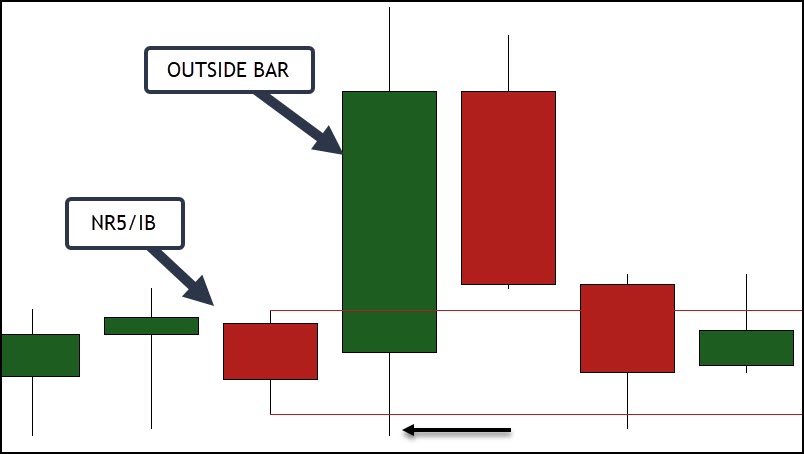
Each of these candlesticks have the smallest range out of the last 5 AND form an inside bar.

Recent trade examples
This is a daily stock chart (BLDP) and the previous day was completion of the NR5 as an inside bar. For simplicity sake, I used a 20 period EMA as a trend indicator although price action was showing the uptrend.

The trade entry is a break of the high of the narrow range day.
There are many ways a trader can use for a stop loss and in this example, I am using the extreme low as the stop.
Profit target will be 1R (1 times the risk). Traders can scale out, use trailing stop loss, or any technique that are comfortable with.
You can also use the next resistance level as you have locked in profit at the 1R level. In one day, your long position is entered and your target was hit two hours after market opened. There is a high probability that you hit the 1R target on these trades in the same day.
This is the ticker MAT.

Target hit in one day – four hours after the open.
ARVL

While it looks as if they all work out, some can cause you an issue.
This is the ticker BILL and is a trading example that is not an instant winner.

This was triggered in by .13 and then price failed. Stop loss would not yet be hit and as a trader, is this a fail? We expect price to break the resistance high of the inside day and begin to trend. It didn’t.
Traders may choose to exit by end of day if there is no follow through. This is a continuation pattern and price movement failed to continue. If you exit, you will take slightly less than a -1R loss and if you look at yourself as a risk manger first, that should be attractive.
As an aside, that is certainly a wide range bar pattern beside the inside bar. Often times, these types of candles can take price into a multi-day contraction. You should decide if you will skip any setup that has a day like that prior to the NR5 or need it to be one of the first few candles of the 5 day pattern.
The NR7 Pattern Trading Setup
Besides adding 2 days and no need for an inside bar, this is similar to the NR5IB.

Daily chart of ACI. A good example of a valid setup that never triggers. Because the last candle is also larger than the previous candle, this chart would not longer qualify as a setup.
Here is BAX. In this example, the spike up was off the open and you were in and out of this trade with profit before you finished a coffee.

No need to go over too many charts as these wouldn’t be traded any differently.
Day Trading NR7 Bars
This is a 15 minute chart of GME.

The second NR7 count includes the first signal candle as well because the second one is a smaller range.
For best results, a trade management plan that allows you to take profits, reduce risk, and to capitalize on a move that makes new highs in an uptrend would be good to have.
You may also expect these to be a short-term pattern for intraday trading and just take the profits at 1R or better. Again, all time frames will be traded the same way in terms of entry and stop loss criteria.
Narrow Range Patterns – Which Is The Best?
There are more limitations on trading the NR5 when you require an inside bar as the fifth bar. You will find many narrow range 7 bars which could lead to over trading.
One way to increase the value of a NR7 bar is to utilize them during a pullback and subsequent rally in price.

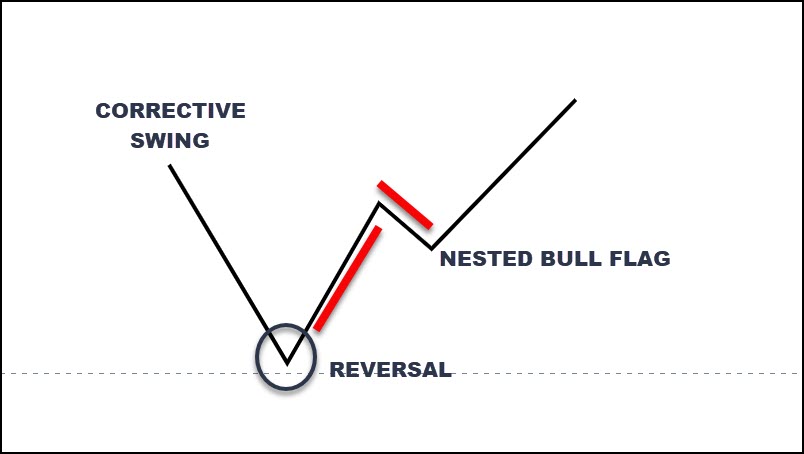
Assume we have a corrective swing in an overall uptrend. We see a reversal and a slight pause in the advancement of price. Barring any sudden momentum to the downside, this is a bullish chart pattern and we expect future price direction to be up.
The nested bull flag won’t always be obvious, it may never happen, but somewhere during the red lines, we could look for a NR7 bar. We would then trade it as normal.

Five minute chart of crude oil gives us our corrective decline, a reversal, NR7 bar as our buy signal, and the trade takes off.
+ Buyers step in off the lows
+ Brief slowdown in the volatility of the instrument
+ Gives you an entry signal
While I didn’t show examples, both of these types of candles are good for a bearish signal as well for a downtrend.
Should You Bracket An Order For NR5IB?
A bracket order would setting a buy stop above the high of the inside NR5 bar and a sell stop below the low.
While we never know which way the volatility expansion will take place, this technique allows a trader to get in a trade with either direction.
The big issue with this is whipsaw as price heads to the downside, reverses, and rips back to the upside often forming an outside bar.

This one hour chart actually triggered short and then reversed. One way to play this is as follows:
- At one point, the big green candle was red
- Once you see price regain the bar open price and turns green, you could reverse your position to long
- An aggressive day trader would reverse the position once the low of the inside bar is reclaimed
You must accept you may be entering a trade just before another small range bar forms. You will need to decide on a “circuit breaker” – when you will move on from the setup.
Conclusion
There is nothing extra special about these bars.
- We are just seeing a drop in volatility over a set period of time
- We then expect to see an expansion of that volatility
Why do we use a NR5 over a NR4? We are looking at a full trading week when using the adjustment of five.
I would much prefer trading in the direction of the trend. Any breakout has the potential to run however the odds are better in the overall trend direction.
Using 1R as your first target is a consistent way of using them. You could certainly use a multiple of the average true range for your targets.
Stop loss should be tight given the context of what we are trading. We expect the breakout of the high or low to move in the direction of the trend. Any failure of price to do so, for me, is a failure of the pattern.
Raschke will switch to a breakout mode the day after the NR7 forms. She won’t countertrend trade and will only look to enter the market in the direction it is moving. She uses the bar as information. That would be a great time to use a breakout pullback style of trading.
This is a good starting point for you to develop a trading method that uses these 2 patterns.
Further Resources
If you can see the power in volatility contractions, you may find value in the following tutorials:
