- October 19, 2021
- Posted by: Shane Daly
- Category: Trading Article
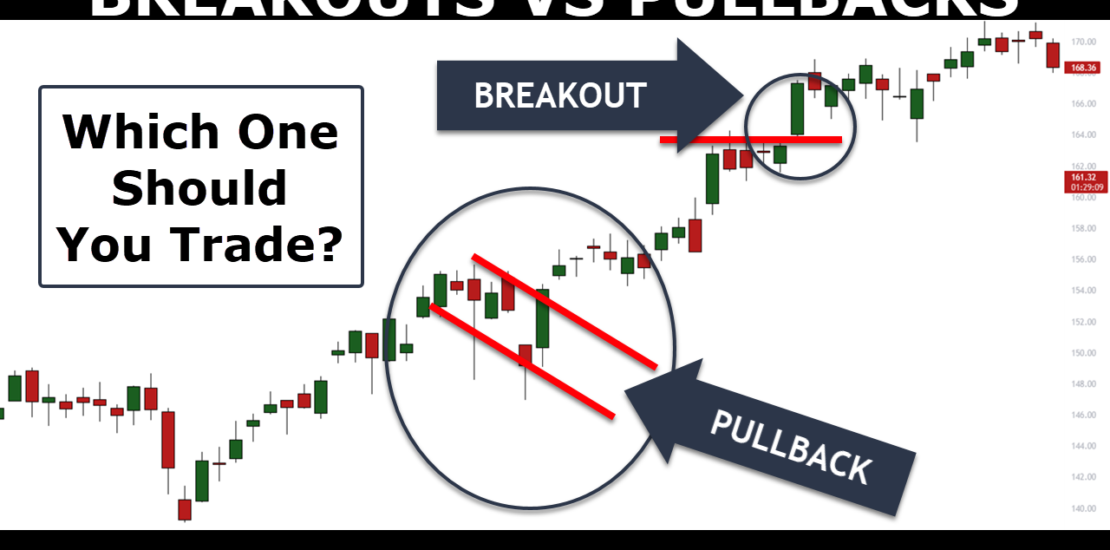
If you want to have a spirited conversation with a fellow trader, pick a side in the breakout or pullback debate.
Sometimes I feel that trading methods become as partisan as politics with one side thinking their side is the way to go.
But…..the truth is that the title of this post is a misleading as this is not an either/or situation.
You can trade both breakouts and pullbacks with an understanding of the pluses and minuses associated with each one.
Details matter and when I say trading pullbacks, I actually mean the reversal out of the pullback. Trading the pullback would be a mean reverting strategy as you position against the main trend. (A reader actually asked that question months ago which made me rethink how I talk about pullbacks!)
Trading breakouts has different meanings but only one is really accurate and we will cover that soon.
What Are Pullbacks and Breakouts?
Here are two simple definitions of both:
- A pullback is a corrective move in price against the impulse move of the main trend direction. A pullback is classified as either one leg (simple) or two legs (complex correction)
- Breakouts are when price action breaks a support level to the downside or a breakout of resistance to the upside
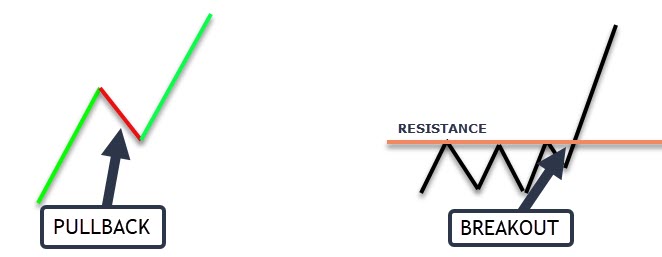
Your pullback is taking advantage of the evolution of price. Price moves in waves called impulse moves and corrective moves. You can see on the left the market moves up and eventually rolls over into a pullback. At some point, price attempts to head back into the direction of the original move through some type of reversal.
A breakout occurs when a defined support or resistance level gets broken by price. There are times when price does not alternate between impulse and corrective swings and simply trades between two levels. This is often described as the accumulation (buying) or distribution phase (selling) of a market.
This buying and selling is done in a manner and at a volume that does not move the market enough to facilitate a trend move.
How do we discuss the pros and cons of each?
Failures of Breakouts and Pullbacks
You don’t need someone to tell you which one to trade. Once you know what the failures of a pullback or breakout are, you can decide for yourself (again, it can be both!).
How A Pullback Fails
When traders see a pullback in a strong trend, the expected outcome is a reversal back in the direction of the trend. There will be times that something else happens:
- Momentum moves in the direction of the pullback (location matters)
- Price pulls back and goes flat
- Failure to make new highs
Each of those presents a different issue for a trader deciding which trade to focus on.
Momentum Against Trend
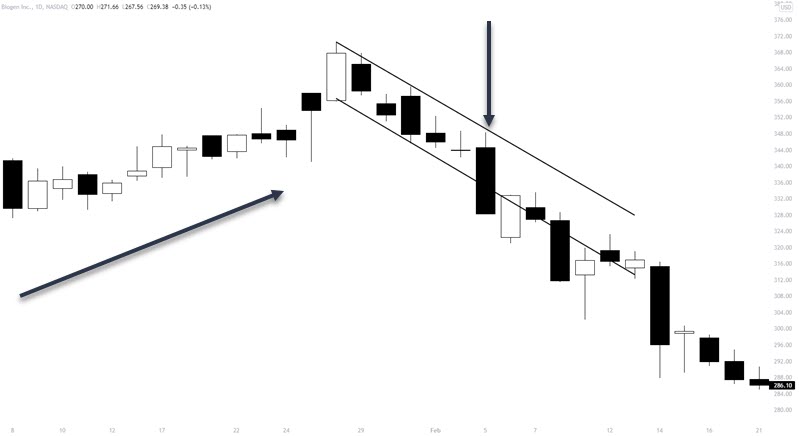
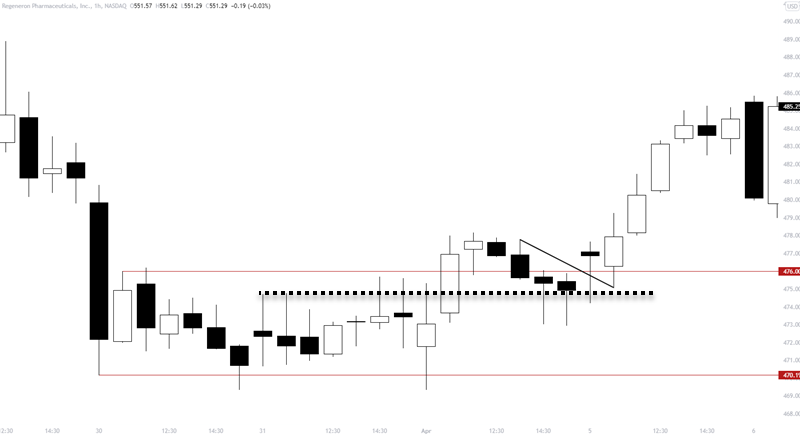
This was a steady up trending market and it started off as a decent pullback in price. I used a simple trend channel to show how, at the black arrow, price broke the rhythm of the down move with momentum. There is no lower shadow to show that buyers bothered to step in to support the price.
If you were trading with pullback entries, this is one you’d take off your list.
Price Goes Flat
This is when price begins it’s pullback and instead of reverses, goes into a trading range.
Three days of a down move in price and you get a reversal candlestick. Instead of price reversing and continuing the up trend, price goes into a multi-day trading range. If you went long on a break of the high of the reversal candle, it would be a painful trade to sit through.
Failure To Make New High (Or Low)
In a trending market, we expect price to continue to trend which means making higher highs and higher lows for an uptrend.
Once price fails to do that, we could consider the makings of a trading range.
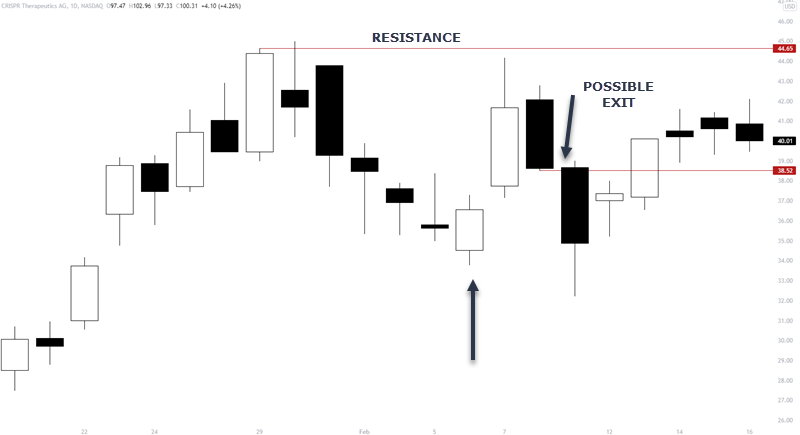
Pullback has small candles and even lower shadows showing some type of accumulation at those price. We see a reversal take place and price stalls near the resistance level.
Once the inside bar forms, this one is a true bearish candle with a close at the lows, you may want to adjust your stop-loss order to exit at a break of the low.
Depending on how you take your profits, this could have been a trade that takes some money from the market.
What Would You Do?
Go back over these three examples and even though you know how they turn out, where would you have entered these pullbacks, if you would have?
Where would you have placed your stop-loss?
Pullbacks come in all different formations so don’t get bogged down in the perfect looking pattern. All you are doing is seeing a natural pause in market action, looking for a reversal entry, and expecting further continuation.
But, as you have seen, they fail.
Breakout Failures
Once you can define a horizontal support and resistance level, you can consider looking at a trading range and breakout trades. These, like the pullback, are how the market moves.
Some will call these “failed breakouts” but if you want to be exact, price did break out of the range. The “breakout failed” in the direction of the breakout, it didn’t fail to breakout. (details matter).
Price breaks that is above these defined levels (for a long trade) is considered a breakout. Traders will generally use a buy stop order at these levels for longs.
Great example of a successful breakout trade that ran 22% from breakout to highs – traders bought when price broke resistance level. At these levels, you will find it can be extremely volatile and they all don’t look this perfect.
If you are taking trades at the breakout, and price fails to run and turns in the opposite direction, we have a failure. A breakout fails by price convincingly coming back into the range after a brief excursion outside the levels.
You can argue that the first failure can be an actual entry into a breakout that you expect to continue to the upside.
You would be correct. That is called a failure test and can be an excellent entry into a trading range where you position before the breakout or for range traders.
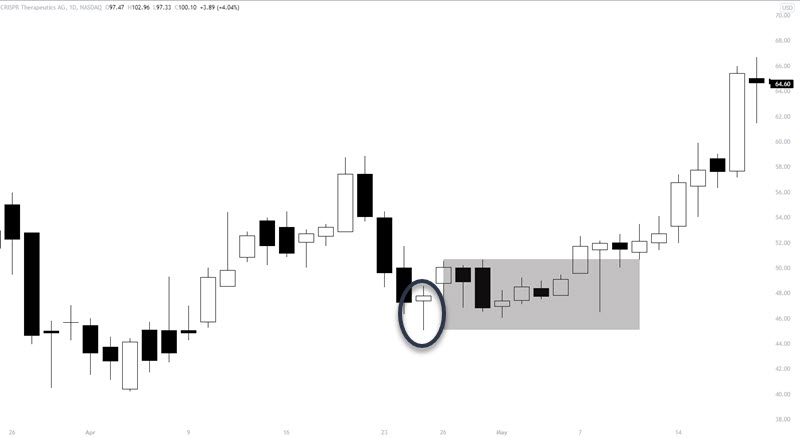
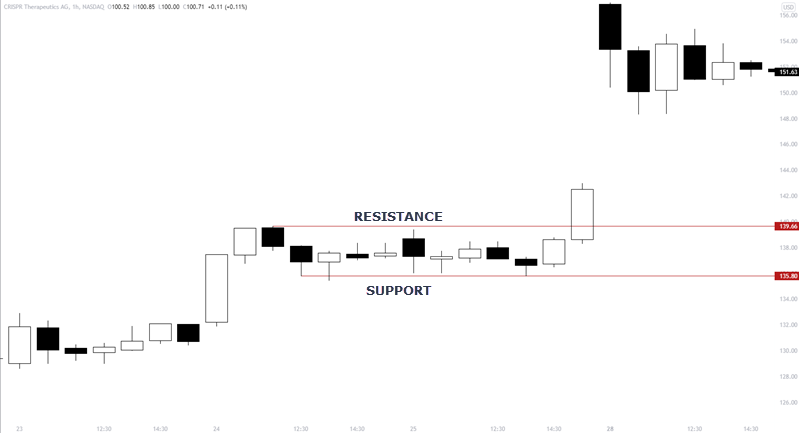
This is a great example of extreme volatility at the break and a perfect failure of the breakout. This is where price has convincingly came back inside the range.
Although the basing that we see at the break is constructive for a continuation long (think concept – although not a fan of the large candle that broke highs), sellers left no doubt they wanted back below pre-breakout levels.
Breakouts can fail back inside the range, in the other direction, or form a new range outside the original breakout level at a new area of support (resistance become support). I won’t get into your stop loss in this article but you can learn more about how to trade ranges here.
Breakouts Or Pullbacks – Which Is Better?
There is not a this/that answer. In fact, you can use both as part of your trading strategy.
A breakout strategy that incorporates a pullback strategy is the best of both worlds.
Most traders have heard that trading the first pullback after a breakout is a good strategy. If you use what you learned in the pullback section, it is definitely a solid trading approach.
How would you play this?
- Trader defines a trading range
- Price breaks out of the range showing, at least in the short term, momentum in that direction
- Price pulls back in an area around the breakout level
- Traders use their techniques to find an entry price – it may be a better price than playing the actual breakout
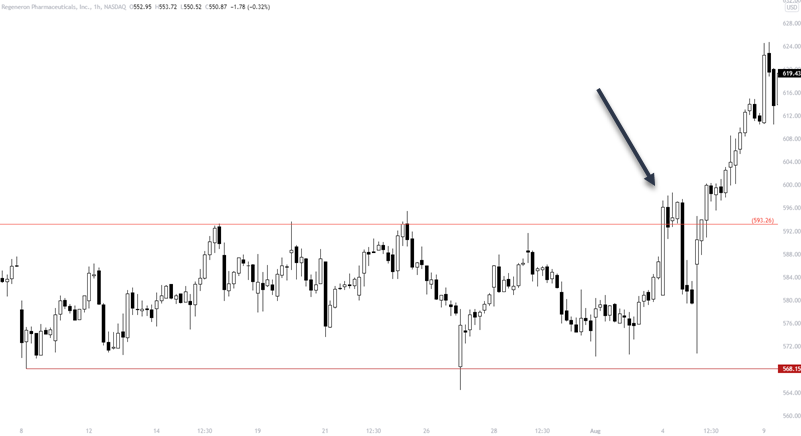
One more example of a breakout pullback trade.

As you can see, there is a lot of merit is using breakouts to set up a pullback. While there are other ways to trade around ranges, this method is my favorite way of handling breakouts.
Will you miss a trade?
Sometimes.
But there are plenty of instruments you can trade.
How else can you combine a pullback and a breakout?
Use the breakout as an entry trigger for a reversal from the pullback,
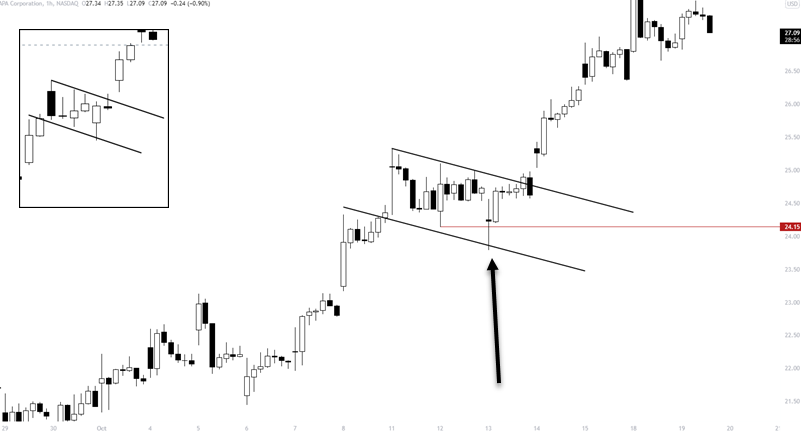
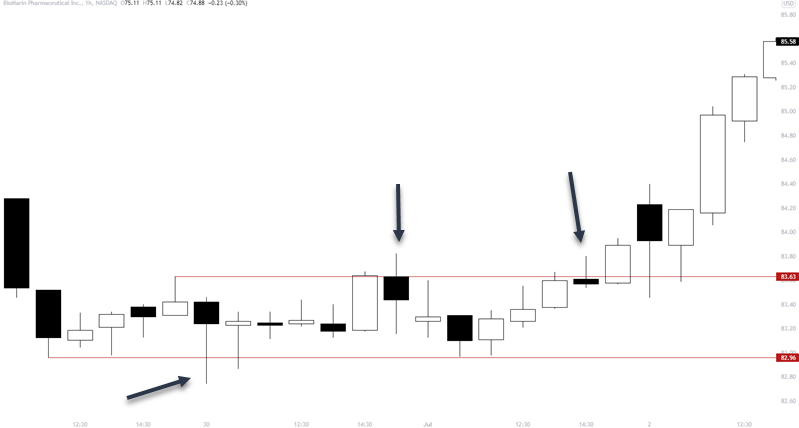
In this example, the small box is a higher time frame pullback in price.
Using a breakout into the pullback uses a lower time frame.
- Price puts in a test of the swing low and buyers step in – this is an entry although not a breakout entry. You are positioned before the breakout.
- At the top of the channel, price closes above resistance, you enter, and after a small retrace, gaps up higher
One benefit of using a breakout as an entry into a higher time frame pullback is the ability to set a tight stop. This allows a larger position size and if momentum steps in early, you can adjust your stop more. I find this is a better risk management strategy as I can reduce risk when seeing momentum on the lower time frame.
I will take a small loss if too aggressive but always read what the price movement is telling you.
Conclusion
As you will probably guess, I suggest you take a look at both ways of trading and use them together.
There is some discretion of course –
- How you draw your support and resistance zones will matter when looking for breakouts
- What a pullback looks like to you – do not get caught up in a perfect looking formation
- Will you use volume or a momentum indicator to gauge price movement?
- Will you use other forms of technical analysis such as candlestick patterns?
All those must be decided upon before thinking of using real money in the market and committed to your trading plan.
Above all, ensure that you do not risk any amount that will drain your trading account when a trade goes against you.