Bull flag patterns offer reliable trading opportunities in upward markets by combining strong price rises with brief consolidation periods. Traders can spot these patterns when a sharp upward price move (flagpole) is followed by a slight downward drift (flag) with lower trading volume. Successful trading requires waiting for price breakout above the flag’s upper trendline, setting clear stop-losses, and managing position sizes. Understanding the pattern components and proper risk management leads to more profitable trades.
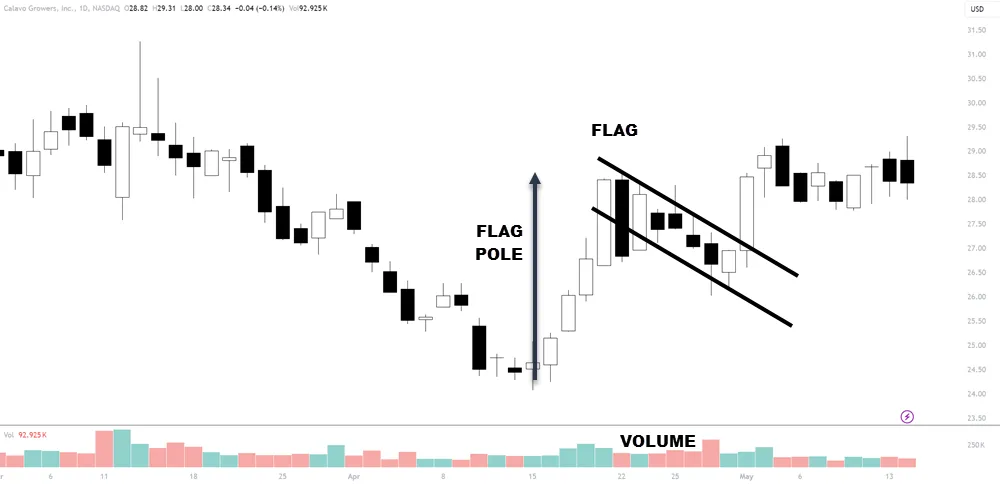
Bull Flag Chart Example
Quick Overview
Enter trades when price breaks above the flag’s upper trendline with increased volume confirmation.
Set profit targets using the height of the flagpole measured from the breakout point.
Place stop-loss orders below the flag’s lower trendline to protect against unexpected reversals.
Verify strong upward market trend exists before trading bull flag patterns.
Wait for consolidation with decreasing volume during flag formation before entering positions.
What Makes a Bull Flag Pattern
Imagine a flagpole with a flag – this visual perfectly captures what traders call a bull flag pattern. The “flagpole” represents a strong upward price movement, while the “flag” shows a brief pause where prices drift slightly lower.
The bull flag characteristics comes from natural market psychology. After a sharp rise, some traders take wins to not lose them, causing a temporary dip.
This consolidation period typically shows lower trading volume as the market catches its breath.
The pattern suggests that once this brief rest is complete, prices are likely to continue their upward move, making it a valuable tool for timing market entries.
Aspect
Explanation
Importance
Historical Context
Originates from technical analysis principles developed in the early 20th century.
Helps validate its long-term reliability.
Pattern Psychology
Reflects temporary profit-taking before a renewed buying interest.
Indicates strong bullish sentiment.
Common Issues
Misidentifying the pattern or entering too late can lead to losses.
Awareness helps avoid costly mistakes.
Timeframes Suitability
Effective across various timeframes, but more reliable in higher ones.
Ensures flexible application.
When analyzing charts, a bull flag’s reliability depends on the volume during the consolidation phase. Lower volume during this period is typically a bullish sign, confirming that the pullback is temporary. To avoid common issues, make sure the pattern’s formation aligns with broader market trends and fundamental factors. You do not want to see strong momentum against the overall trend direction during the corrective phase.
Identifying Bull Flag Patterns
To identify bull flag patterns, you need to focus on distinct characteristics like the sharp upward movement followed by a consolidation phase. Analyze variations in these patterns by examining the flag’s slope, duration, and volume during the pullback.
Charts should show tight ranges and declining volumes during consolidation, signaling a potential upward breakout.
Characteristics of a bull flag
When identifying a bull flag pattern, look for a strong upward movement called the flagpole, followed by a period of consolidation forming the flag.
Pay close attention to volume; it should spike during the flagpole formation and decrease during the flag consolidation. The other main thing is if there is no volume on the breakout, you do need to see increased trading activity soon after the break. If not, the pattern may likely fail.
These characteristics play a key role in confirming a bull flag and predicting a potential breakout.
Flagpole and flag formation
Identifying a bull flag pattern starts with spotting the flagpole, characterized by a sharp, vertical price increase on a chart, followed by a consolidation phase that forms the flag. This pattern suggests trend continuation, as the price patterns reflect market psychology and investor optimism. I like to see a 15% jump in price during the flag pole formation.
During flag consolidation, technical analysis focuses on tight, parallel lines, indicating a brief pause before the upward trend resumes.
Volume considerations during the pattern formation
Analyzing volume during the pattern formation is essential, as increasing volume on the flagpole and decreasing volume during the consolidation phase typically confirm a bull flag pattern.
Look for volume spikes that indicate strong interest in the initial upward move. During consolidation, low volume and volume divergence suggest a pause.
Volume trends and volume confirmation upon breakout validate the pattern’s potential.
Variations of bull flag patterns
When identifying bull flag patterns, you’ll encounter variations such as the flat top breakout, descending flag, and bull pennant. Each pattern displays unique characteristics in price movements and consolidation periods that you can spot on your charts.
Analyzing these variations helps you make data-driven decisions for trading strategies.
Flat top breakout
A flat top breakout in bull flag patterns is characterized by a consolidation phase where the stock price forms a series of higher lows, but the highs remain relatively flat, indicating strong resistance at a specific level.
Understanding psychological factors, market sentiment, and breakout psychology is important. Trader psychology and emotional discipline play key roles in identifying this pattern and predicting potential breakout movements.
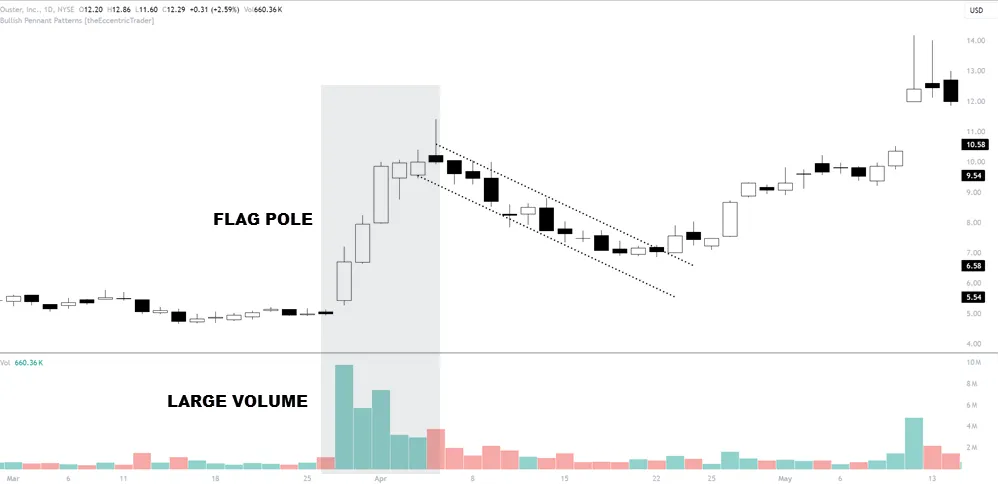
Descending flag
The descending flag variation stands out as it features a downward-sloping consolidation phase that often precedes a powerful upward breakout.
In a bear market, this pattern plays a significant role in swing trading. Watch for price channels and use Fibonacci retracement to confirm the setup.
Despite a downtrend continuation, a breakout signals potential bullish momentum.
Bull pennant
Why is the bull pennant a pattern you should learn to identify? Recognizing it signals strong market sentiment and trend continuation.
During flag consolidation, prices form a small symmetrical triangle. Pattern recognition here is key; a breakout above the pennant’s upper trendline confirms bullish breakout psychology.
Accurate charts help you spot these patterns, enhancing your trading strategy and capitalizing on market momentum.
Trading Strategies Using Bull Flag Patterns
Successful bull flag trading relies on three essential components that work together.
The first component is trend confirmation, which involves verifying the strength of the existing uptrend before entering a trade.
Next is understanding bull flag psychology, where traders recognize that temporary price dips often represent profit-taking rather than trend reversal.
The final piece focuses on proper trade execution, including setting clear entry points when prices break above the flag pattern and establishing stop-loss levels to manage risk.
These elements combine to create a systematic approach to trading bull flags effectively.
Entry and exit strategies
To effectively trade bull flags, you should enter when the price breaks above the flag’s resistance on increased volume. Set your stop-loss just below the flag’s support to manage risk.
Aim for profit targets using the flagpole’s height, projecting it from the breakout point for a data-driven exit strategy.
When to enter based on breakout
Identifying the optimal entry point in a bull flag pattern depends on recognizing the breakout above the flag’s resistance line, typically confirmed by a surge in volume (but not always) and bullish candlestick formations.
Assess breakout psychology and market sentiment across multiple time frames to gauge reliability. Effective risk management is essential, as post-breakout trends can be volatile. Often times there is a revisit to the breakout point before the trend fully resumes.
Setting stop-loss and profit targets
Setting stop-loss and profit targets in bull flag patterns requires an analysis of support and resistance levels to mitigate risk and optimize returns. Psychological factors, market sentiment, and trading psychology heavily influence these decisions. Maintaining emotional discipline is key to effective risk management.
Factor
Impact
Action
Support Levels
Define stop-loss
Place stop-loss below support
Resistance Levels
Set profit targets
Place targets near the resistance
Market Sentiment
Influences decisions
Stay updated
Psychological Factors
Affects discipline
Stay calm, stick to the plan
Risk Management
Mitigates losses
Use defined stop-loss
Combining bull flag patterns with other technical indicators
To enhance the reliability of bull flag patterns, combine them with moving averages and the Relative Strength Index (RSI).
You’ll often see a bull flag forming above key moving averages, indicating strong upward momentum.
Additionally, an RSI above 50 reinforces the bullish sentiment, providing further confirmation for your trade setup.
Using moving averages and RSI for confirmation
Leveraging moving averages and the Relative Strength Index (RSI) can enhance your ability to confirm bull flag patterns and make more informed trading decisions.
Moving averages help you gauge trend strength, while RSI confirmation provides insights into price momentum.
Look for indicator convergence where both moving averages and RSI align, indicating a robust continuation of the upward trend highlighted by the bull flag.
Your Questions Answered
How Long Does a Typical Bull Flag Pattern Take to Form?
A bull flag chart pattern formation typically develops over varying timeframes, from a few hours to several weeks.
The duration largely depends on the trading timeframe being analyzed – shorter on intraday charts and longer on daily or weekly charts.
Most commonly, these patterns form within 1-5 days on daily charts, with the consolidation phase representing a brief pause in the larger upward trend.
Can Bull Flag Patterns Be Traded Effectively in Cryptocurrency Markets?
Bull flags can be effectively traded in cryptocurrency markets, though traders must account for higher cryptocurrency volatility.
These patterns work well in crypto because digital currencies often show strong trending movements followed by consolidation periods.
Successful trading requires careful attention to price action, volume indicators, and proper risk management.
Setting wider stop losses may be necessary to accommodate crypto’s characteristic price swings.
What Percentage of Bull Flag Patterns Successfully Lead to Continuation?
While exact percentage success rates for bull flag patterns vary across different markets and timeframes, studies suggest they typically have a 60-75% success rate when properly identified.
However, successful bull flag analysis depends heavily on market conditions, trading volume, and adherence to strict entry/exit criteria.
Traders should remember that even reliable patterns can fail, making proper risk management essential regardless of historical success rates.
Which Technical Indicators Best Complement Bull Flag Pattern Trading Strategies?
Moving Averages help confirm the overall trend direction and potential support levels during bull flag formations.
Volume Analysis shows if there’s strong buying interest behind the pattern.
RSI Confirmation can indicate whether the market is overbought or has room to continue upward.
Trend Strength indicators, like ADX, help validate if the underlying trend is solid enough to support a continuation pattern.
Are Bull Flag Patterns More Reliable in Specific Market Sessions?
Bull flag patterns tend to be more reliable during high-volume market sessions when session volatility is more predictable.
The most effective times are typically during main trading hours when institutional traders are active. Market analysis shows these patterns work best in the first few hours of major market opens, particularly in US equity markets, as increased participation helps validate the pattern formation and subsequent breakout.
Conclusion
Trading bull flag patterns successfully requires understanding their key components and following disciplined trading practices. By recognizing proper pattern formation, implementing smart entry and exit strategies, and maintaining strict risk management, traders can better capitalize on these continuation patterns. While bull flags offer promising opportunities in upward markets, avoiding common mistakes and staying patient during consolidation periods remains important for consistent results.
Author:Shane Daly
Shane started on his trading career in 2005 and sought a more structured approach to his trading methodology. This lead becoming a Netpick's customer in 2008. His expertise lies in technical analysis, incorporating a macro overview for effective trade filtering. Shane's trading philosophy has been influenced by several prominent traders, contributing to his composed and methodical approach to market engagement.
Initially focusing on day trading in the Forex market, Shane has since transitioned to a swing and position trading strategy across various markets, including stocks and futures. This shift has allowed him to optimize his time management without compromising his trading performance. By adopting longer-term trading horizons, Shane has successfully reduced his screen time while maintaining consistent returns.
By using this site, you agree to the storage of cookies on your device for enhanced navigation, site analysis, and NetPicks's marketing. Data sharing with social media platforms might occur based on the privacy choices you make on those platforms. For specifics, see our Privacy Policy.