
- May 14, 2024
- Posted by: Shane Daly
- Categories: Trading Article, Trading Indicators


Understanding the nuances of volume can make a difference in your trading. You can have the ability to see the shift between supply and demand, offering you a clue into the future direction of prices especially in the shorter term. By understanding the power of volume analysis, you can see patterns and signals that might escape the untrained eye.
Main Points
- High volume confirms trend strength and direction.
- Volume spikes indicate potential trend changes.
- Volume analysis complements price action for trend confirmation.
- Low volume may precede trend reversals.
- Monitoring volume patterns aids in trend identification.
Importance of volume analysis in revealing trends

Volume analysis plays a role in uncovering and understanding market trends. By analyzing the volume of trades in an instrument, you can gain information about the strength and sustainability of a trend.
Increasing trading volume during a price uptrend, for example, can indicate a higher level of interest and participation, supporting the trend’s confirmation. Conversely, declining volume during a price uptrend may suggest weakening momentum and potential trend reversal.
Monitoring volume alongside price movements helps gauge the market sentiment and identify potential trend shifts. Volume analysis is a powerful tool that provides a deeper understanding of market trends beyond what price movements alone can reveal, making it an essential component in your trading strategy for making informed decisions.
Key concepts and tools
Understanding the dynamics of supply and demand is important in interpreting volume analysis. The volume and price relationship plays a significant role in identifying potential market trends, as changes in volume often precede price movements.
Additionally, keeping an eye out for volume divergence can provide valuable insights into potential trend reversals or continuations. By incorporating these key concepts and tools into your analysis, you can develop a more thorough understanding of market trends and make more informed trading decisions.
Understanding Volume and Its Relationship to Price
Volume in trading refers to the number of shares or contracts traded in a security or market during a given period. Understanding how volume and price action interact can provide valuable insights into market dynamics and potential future price movements.
Analyzing volume is a great tool for assessing market sentiment and confirming the strength of a price trend.
Definition of volume in trading
Understanding the relationship between trading volume and price movements is important for market analysis. When it comes to volume in trading, it refers to the number of shares or contracts traded in a security or market during a given period.
Here are some key points to keep in mind:
- Buying Pressure: High volume during an uptrend indicates strong buying pressure, potentially leading to a price increase.
- Selling Pressure: Conversely, high volume in a downtrend suggests significant selling pressure, which could drive prices lower.
- Volume Indicators: Traders often use volume indicators like the Volume Weighted Average Price (VWAP) or On-Balance-Volume (OBV) to analyze market sentiment based on trading volume.
How volume and price action interact
Analyzing the interaction between volume and price action provides valuable insights into market dynamics and potential trends. Volume analysis helps traders understand the strength behind price movements. When the price rises or falls on high volume, it indicates strong conviction among market participants, suggesting a potential trend continuation.
If the price moves on low volume, it may signal a lack of interest and a possible trend reversal. Monitoring price action alongside volume analysis is essential for making informed trading decisions. A sudden spike in volume during a period of consolidation could point towards a breakout, while decreasing volume during a trend may indicate weakening momentum.
Understanding how volume and price action interact can enhance your ability to anticipate market movements and identify potential trend reversals.
Significance of volume in assessing market sentiment
Assessing market sentiment through volume is an important aspect of understanding price dynamics and potential trends. When analyzing market sentiment through volume, consider the following:
- Volume-based trading strategies: Volume can provide valuable insights for developing effective trading strategies.
- Identifying market trends with volume: High volume often accompanies strong trends, signaling potential opportunities for traders.
- Confirming trends using volume analysis: Volume can help confirm the strength of a trend, providing additional confidence in trading decisions.
Key Volume Indicators for Trend Analysis
When analyzing volume, pay attention to key volume indicators. The on-balance volume (OBV), Chaikin Money Flow (CMF), Accumulation/Distribution Line (A/D), and Volume Price Trend (VPT) are helpful tools for trend analysis.
These indicators provide clues into the strength and direction of price movements, helping you make decisions based on what is occurring in the instrument.
On-Balance Volume (OBV)
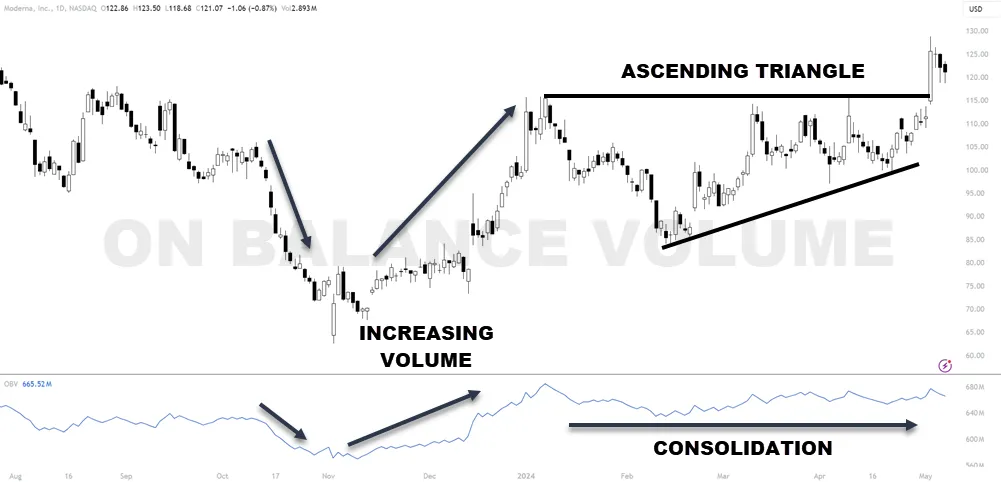
Utilizing On-Balance-Volume (OBV) is useful in effectively gauging market trends through volume analysis. Here are some key points to keep in mind:
- OBV Basics: OBV is a simple yet insightful indicator that adds a volume dimension to price movements.
- Rising Volume Significance: When OBV rises, it suggests that volume is higher on up days, indicating buying pressure.
- A/D Line Comparison: OBV is similar to the Accumulation/Distribution Line (A/D) but focuses solely on volume changes.
Understanding how OBV reflects market sentiment and buying/selling pressure can provide valuable insights into potential trend reversals or continuations. Keep a close eye on OBV alongside price movements to better analyze market trends.
Chaikin Money Flow (CMF)
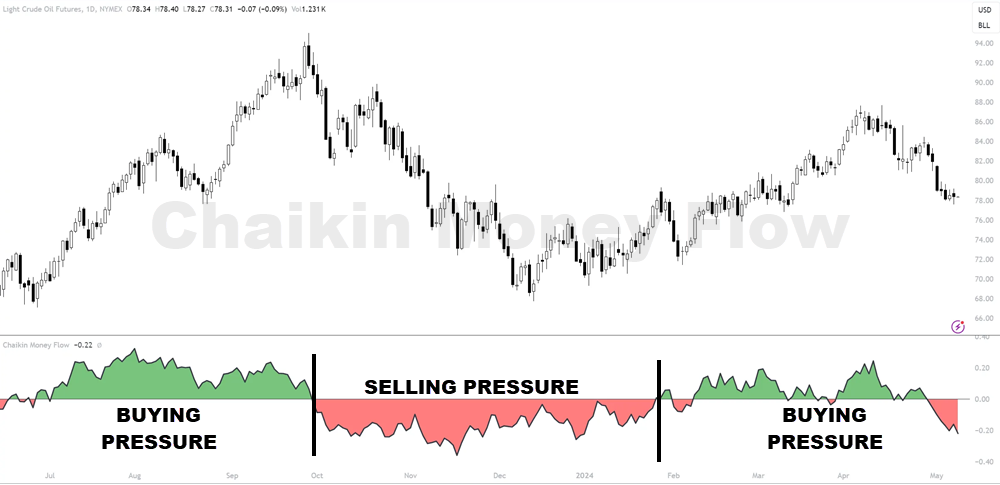
To gain insights into market trends through volume analysis, consider incorporating Chaikin Money Flow (CMF) as a key indicator for trend analysis. CMF combines price and volume to measure the buying and selling pressure for a particular asset. It’s calculated by analyzing the accumulation/distribution line (A/D) over a specific period.
When CMF is above zero, it suggests buying pressure, while below zero indicates selling pressure. CMF can be used in conjunction with on-balance volume (OBV) to confirm trends in the market. Additionally, CMF can help identify high-volume breakouts, indicating potential shifts in market sentiment.
Accumulation/Distribution Line (A/D)

Consider the Accumulation/Distribution Line (A/D) as a volume indicator for analyzing trends in the market. The A/D line can offer valuable insights into market sentiment and potential price movements. Here’s why it’s essential:
- Accumulation/Distribution Line (A/D): Reflects the flow of money into or out of a particular security.
- Volume Spikes: Sharp volume increases can indicate significant buying or selling pressure, influencing the A/D line.
- Trend Confirmation: By comparing the A/D line with price movements, you can confirm the strength or weakness of a trend.
Understanding how the Accumulation/Distribution Line interacts with volume spikes is fundamental in interpreting market trends effectively.
Volume Price Trend (VPT)
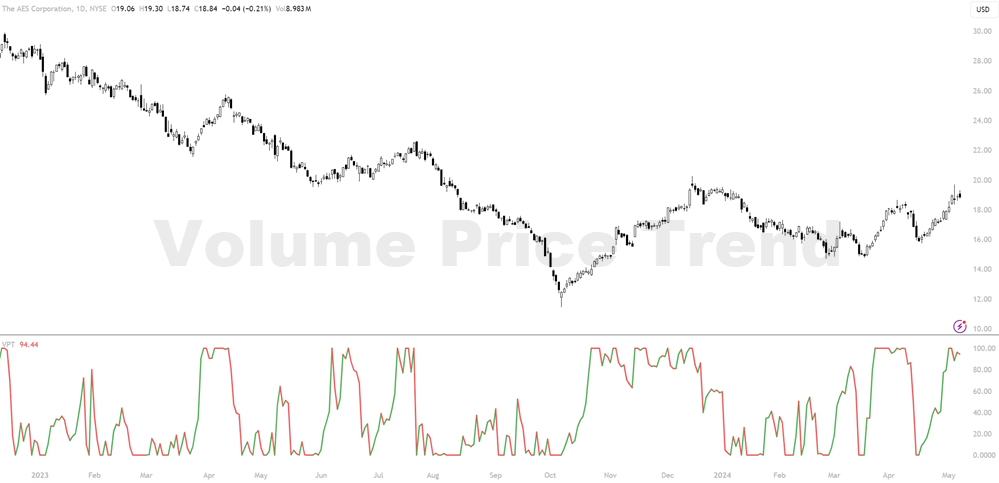
Analyzing market trends effectively involves paying attention to the Volume Price Trend (VPT), a key volume indicator for trend analysis. VPT combines price movement and volume to show the strength of a trend. By analyzing volume patterns, traders can spot potential reversals through volume divergence from price movements.
When the VPT is rising, it indicates a bullish trend, suggesting that the price is likely to continue moving upwards.
Conversely, a falling VPT suggests a bearish trend, signaling potential price declines. Understanding the relationship between price and volume through VPT can provide valuable insights into market trends, helping traders make informed decisions based on the dynamics of supply and demand.
Identifying Bullish and Bearish Trends with Volume
When analyzing market trends through volume, pay attention to rising volume during both uptrends and downtrends. Additionally, spotting divergences between price movements and volume can signal potential shifts in market sentiment.
Rising volume during uptrends and downtrends
During both uptrends and downtrends, observing an increase in trading volume can help identify bullish and bearish market trends. Here’s how rising volume can provide insight into market direction:
- Bullish Trends: When prices are rising accompanied by an increase in trading volume, it indicates strong buying interest and confirms the bullish trend.
- Bearish Trends: Conversely, during downtrends, a surge in volume can signal heightened selling pressure, reinforcing the bearish sentiment in the market.
- Volume Confirmation: Higher volume during price movements validates the strength of the trend, helping traders make more informed decisions based on market sentiment.
Divergences between price and volume

Identifying divergences between price and volume plays a role in recognizing shifts in market sentiment and potential reversals in trend direction.
When interpreting volume signals, the differences between the price movement and volume can indicate a weakening trend. For instance, if prices are rising but volume is declining, it might suggest that the upward momentum is losing strength.
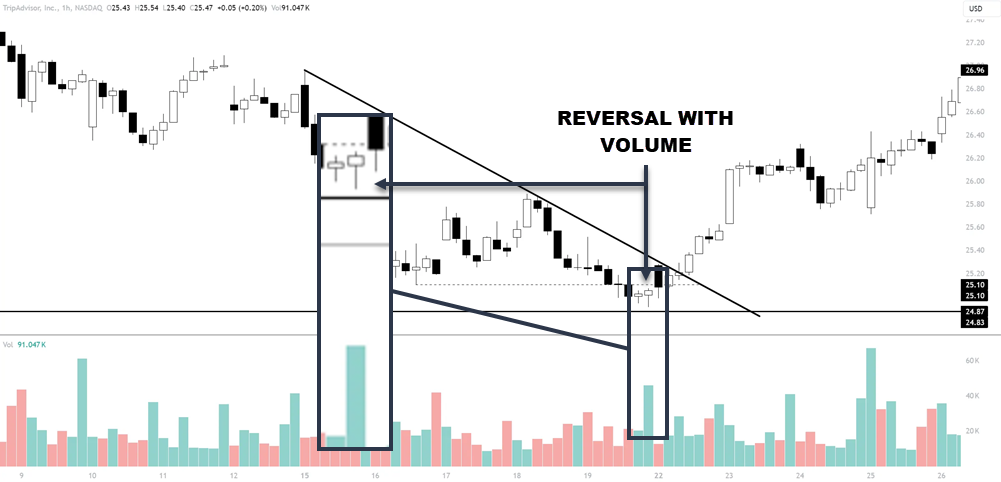
On the other hand, a situation where prices are falling while volume is increasing could signal a potential trend reversal to the downside.
To enhance your analysis, consider combining volume analysis with technical indicators to confirm signals and strengthen your trading decisions.
Spotting potential trend reversals
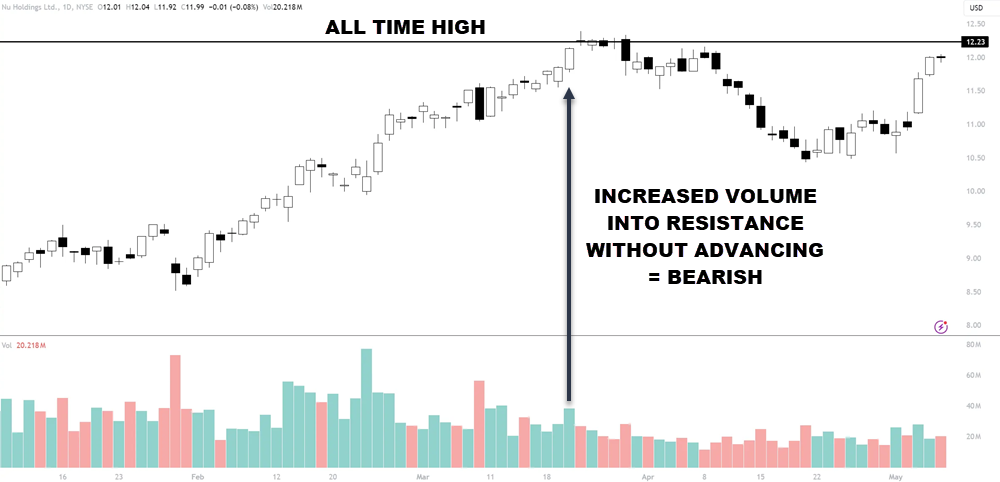
When identifying potential trend reversals in the market, pay attention to declining volume during price advances or declines.
Additionally, keep an eye out for volume spikes at key price levels.
These signals can provide valuable insights into possible bullish or bearish trends that may be on the horizon.
Declining volume during price advances or declines
How can declining volume during price movements signal potential trend reversals in the market?
- Decreasing volume during price advances may indicate weakening bullish momentum.
- Declining volume during price declines could suggest a lack of conviction in the bearish trend.
- False breakouts on low volume may fail to sustain price movements, highlighting the limitations of volume analysis.
Volume spikes at key price levels
Observing volume spikes at key price levels can provide clues into potential trend reversals. Volume analysis in different market conditions highlights the importance of volume in technical analysis.
These spikes can indicate increased interest from buyers or sellers at specific price points, signaling a possible shift in market sentiment. Understanding the significance of volume spikes at key levels is essential for identifying potential trend reversals accurately.
Volume Analysis and Chart Patterns
When analyzing chart patterns, volume plays a role in confirming the validity of the patterns you observe. A key aspect to contemplate is the volume characteristics accompanying reliable breakouts, as they often signal the strength of the trend.
Role of volume in confirming chart patterns
Volume plays a confirming role for various chart patterns, providing valuable insights into the strength and validity of the patterns observed. When analyzing chart patterns, consider the following:
- Volume as a leading indicator: Significant changes in volume often precede price movements, signaling potential shifts in market sentiment.
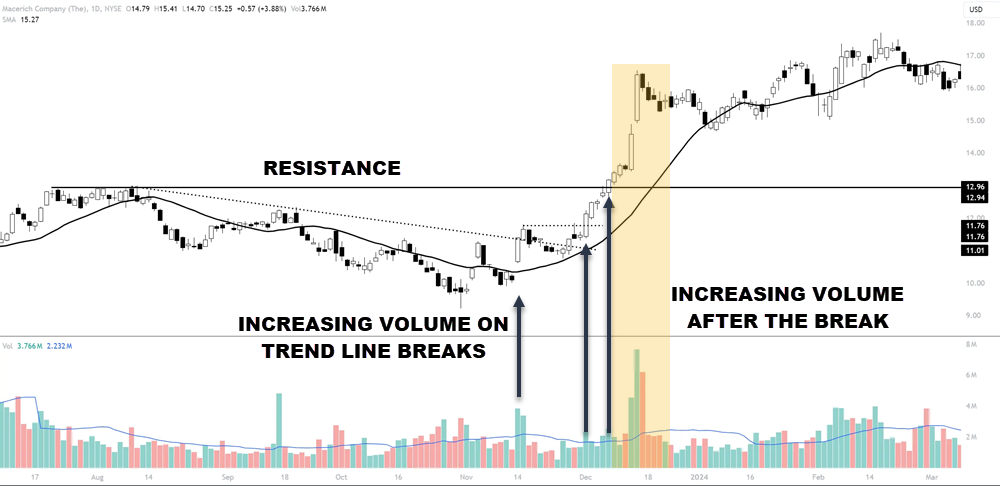
- Volume-based support and resistance levels: High volume at certain price levels can indicate areas where traders are particularly active, acting as support or resistance.
- High volume nodes: These are key price levels where a significant amount of trading activity has occurred, suggesting heightened interest and potential price reversals.
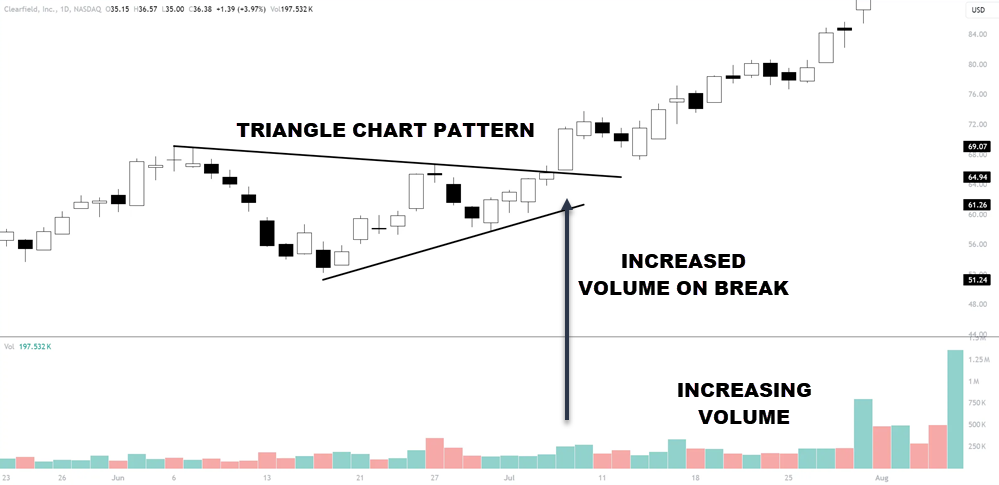
Volume characteristics of reliable breakouts
When looking at the volume characteristics of reliable breakouts, you need to distinguish between high-volume breakouts and low-volume breakouts.
High volume breakouts often signal strong conviction from market participants, indicating a potential sustained move in price.
Low-volume breakouts may lack the necessary momentum to confirm the breakout, leading to potential false signals.
High-volume breakouts vs. low-volume breakouts
Exploring the distinction between high-volume breakouts and low-volume breakouts provides clues to identifying reliable chart patterns.
- Low-volume breakouts can signal weak market sentiment.
- High-volume breakouts often indicate strong market conviction.
- Volume plays a role in detecting potential market manipulation.
Using volume to validate or invalidate patterns
Analyzing patterns with volume can provide clues into the strength and reliability of market trends. By examining the volume associated with specific chart patterns, traders can determine whether the patterns are likely to hold or fail. Here are some key volume indicators that can help you validate or invalidate patterns:
| Indicator | Description | Usage |
|---|---|---|
| Chaikin Money Flow (CMF) | Measures buying and selling pressure | Confirms trend strength |
| Volume Price Trend (VPT) | Combines price movement with volume | Signals potential trend reversals |
| Volume Profile | Displays volume at different price levels | Identifies significant price levels |
These volume analysis tools can improve your pattern recognition skills and improve your overall trading decisions.
Applying Volume Analysis to Different Market Conditions
When analyzing market conditions, you need to evaluate whether you’re dealing with:
- a trending market,
- a ranging market, or
- high volatility compared to low volatility environments.
Each type of market condition presents unique challenges and opportunities for traders looking to leverage volume analysis effectively. Understanding how volume behaves in these different scenarios can help you make better trading choices.
Trending markets
When analyzing trending markets, consider the following:
- Chaikin Money Flow (CMF): This indicator combines price and volume to show how money is flowing in or out of a stock.
- Volume Price Trend (VPT): VPT combines price movement and volume to show the strength of a trend.
- Volume-Weighted Average Price (VWAP): VWAP is a trading benchmark that gives the average price a security has traded at throughout the day, based on both volume and price.
Understanding these metrics can help you identify and capitalize on trending markets efficiently.
Ranging markets
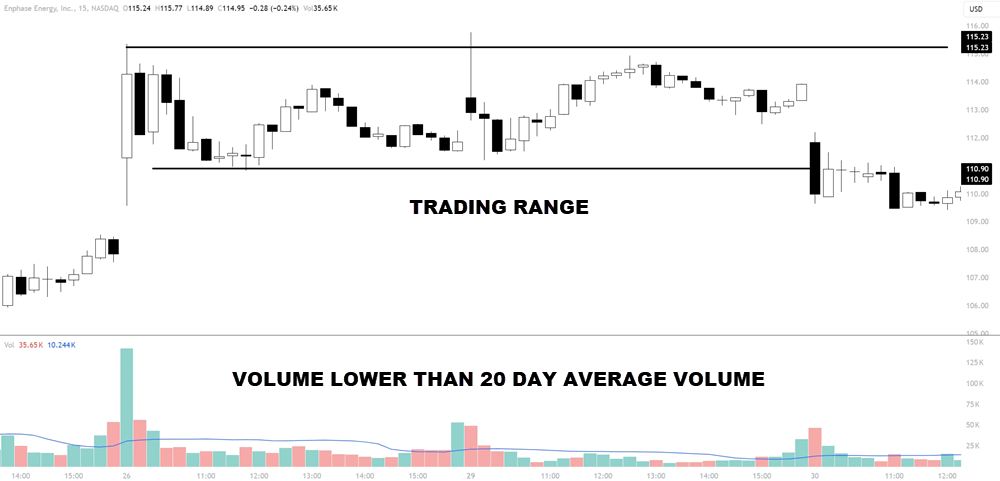
How can volume analysis be applied to ranging markets for trading decisions?
In ranging markets, where prices move within a relatively tight range without a clear trend, volume analysis can provide valuable insights. By examining volume levels during price consolidations, traders can gauge the strength of support and resistance levels.
In a ranging market, low volume during price swings may indicate a lack of conviction among market participants, suggesting potential breakouts or breakdowns. Conversely, high volume at key price levels could signal increased buying or selling pressure, potentially leading to a continuation of the range or a breakout.
Understanding volume patterns in ranging markets can help investors make more informed decisions and adapt their strategies accordingly.
High volatility vs. low volatility environments
Analyzing volume in different market conditions, such as high volatility versus low volatility environments, offers valuable insights for effective investment strategies.
- High Volatility Environments:
- Volume spikes indicate increased trading activity, potentially signaling significant price movements.
- Watch for sudden surges in volume accompanying sharp price changes.
- High volatility can present both risks and opportunities for traders.
- Low Volatility Environments:
- Volume tends to be more stable, with less pronounced fluctuations.
- Look for consistent but moderate volume levels during quiet market periods.
- Low volatility may suggest a period of consolidation or indecision among market participants.
- Utilizing Volume Analysis:
- Combine volume analysis with price action to confirm market trends.
- Adapt trading strategies based on volume insights to align with current market conditions.
- Volume analysis can help identify potential entry and exit points with higher precision.
Integrating Volume Analysis with Other Technical Tools
When analyzing market trends through volume, make sure to use volume analysis with other technical tools.
By combining volume analysis with moving averages, oscillators, momentum indicators, and support and resistance levels, you can gain a more thorough understanding of market dynamics.
These tools work together to provide a clearer picture of potential price movements and market trends.
Moving averages

To combine volume analysis with other technical tools like moving averages, consider the relationship between the two indicators for a thorough market trend analysis.
- Moving averages can help smooth out price data over a specific period, providing a clearer picture of the overall trend.
- Combining volume analysis with moving averages can confirm or refute potential trend reversals or continuations.
- Pay attention to the intersections between moving averages and volume spikes as they can signal significant market movements.
Oscillators and momentum indicators

Combining volume analysis with oscillators and momentum indicators offers a holistic approach to understanding market trends and potential price movements. Oscillators, like the Relative Strength Index (RSI) or the Moving Average Convergence Divergence (MACD), help identify overbought or oversold conditions, providing insight into potential trend reversals.
Momentum indicators, such as the Stochastic Oscillator or the Average Directional Index (ADX), gauge the strength of price movements, indicating whether a trend is likely to continue or reverse. By combining these tools with volume analysis, traders can gain a better view of the market, confirming potential trend changes or identifying areas of price exhaustion.
Support and resistance levels
When analyzing support and resistance levels, use volume analysis with other technical tools. By combining volume signals with indicators like moving averages or trend lines, you can gain a more thorough understanding of what is going on in the market.
Combining volume signals with other technical indicators
When analyzing market trends through volume signals, it’s essential to combine volume analysis with other technical tools, such as support and resistance levels.
Support and resistance levels help identify potential price reversal points.
Combining volume analysis with these levels enhances trend confirmation.
Volume spikes at support or resistance can indicate strong buying or selling pressure.
Common Pitfalls and Limitations of Volume Analysis
When utilizing volume analysis, you must be cautious of false signals. Differences in volume behavior can vary greatly across markets and asset classes, impacting the reliability of your analysis.
To deal with these challenges, take into account the importance of context and engage in multiple timeframe analyses for a complete understanding.
False signals
Avoid falling into the trap of false signals when conducting volume analysis by understanding the common issues and limitations associated with this analytical method. Here are three key points to keep in mind:
- Lack of Context: Volume analysis alone may not provide a full picture of market trends. It’s essential to take into account other technical indicators and market variables for a thorough analysis.
- Market Manipulation: Be cautious of market manipulations that can distort volume data, leading to false signals. Stay vigilant and cross-reference with other sources to confirm trends.
- Low Liquidity: In less liquid markets, volume analysis may be less reliable due to sporadic trading activities. Consider the market’s liquidity when interpreting volume data for accurate insights.
Differences across markets and asset classes
To handle the common pitfalls and limitations of volume analysis effectively, it’s essential to recognize the variances that exist across different markets and asset classes.
Volume analysis can vary considerably depending on the type of market or asset being analyzed. For example, in highly liquid markets like major currency pairs in forex trading, volume data tends to be more reliable and accurate due to the high level of trading activity.
On the other hand, in less liquid markets or with certain asset classes like cryptocurrencies, volume data can be more easily manipulated or less indicative of true market sentiment.
Importance of context and multiple timeframe analysis
Considering the importance of context and the value of multiple timeframe analysis in volume analysis, it becomes important to explore further how these factors can greatly impact your trading decisions.
Here are three key reasons why context and multiple timeframe analysis are essential in volume analysis:
- Trend Confirmation: By analyzing volume across different timeframes, you can confirm the strength of a trend and make informed decisions.
- Identifying Reversal Points: Contextual analysis helps in spotting potential reversal points, providing opportunities to enter or exit trades strategically.
- Reducing False Signals: Multiple timeframe analysis helps filter out noise and false signals, leading to more accurate trading decisions.
Frequently Asked Questions
How Can Volume Analysis Help in Predicting Market Reversals?
To predict market reversals, volume analysis is key. Watch for spikes or sudden drops in trading volume. These shifts can indicate potential market turning points. By analyzing volumes, you can better anticipate market movements.
Are There Specific Volume Patterns That Indicate Market Manipulation?
You can identify potential market manipulation by observing abrupt spikes in trading volume, unusual price movements not supported by volume or consistent patterns of high volume without corresponding price changes.
Can Volume Analysis Be Applied to Cryptocurrency Markets Effectively?
Yes, volume analysis can be applied effectively to cryptocurrency markets. By studying trading volumes, you can gauge market sentiment, identify potential trends, and make better decisions.
How Does News and External Factors Affect Volume Analysis Accuracy?
When news and external factors impact volume analysis, accuracy may fluctuate. Stay vigilant for sudden changes or spikes caused by breaking news or market-moving events. Keep a close eye on the interplay between volume and external influences.
Is There a Correlation Between Volume Analysis and Market Volatility?
When analyzing market trends, volume analysis and market volatility are closely correlated. Monitoring trading volume can provide insights into the intensity of market movements, helping you anticipate potential shifts in market volatility.
Conclusion
Volume analysis is a valuable tool for traders to understand market trends and make better trading decisions. By monitoring trading volume alongside price movements, traders can gain insights into the strength and direction of trends, confirming market sentiment.
Utilizing key volume indicators and identifying bullish and bearish trends can help traders navigate various market conditions effectively. Combining volume analysis with other technical tools improves trend analysis, providing a holistic view of market dynamics for strategic decision-making.