- April 2, 2024
- Posted by: Shane Daly
- Categories: Basic Trading Strategies, Trading Article
It’s good to use indicators like moving averages and volume for confirmation to avoid false breakouts. Wait for the candle to close and retest after the breakout. Analyze different time frames and set stop-loss orders.
When breakouts fail, consider trading reversals and always manage your risk. Identify false breakouts using MACD and ATR, especially during high volatility. Understand how psychological factors influence the market.
Look out for complex chart patterns and validate breakouts on multiple time frames. Mastering these techniques goes a long way in helping you avoid losses from failed breakouts.
Main Points
- To confirm breakouts, you can use indicators like moving averages and volume.
- Wait for candlestick patterns to close to confirm breakout directions.
- Watch for retests and follow-throughs after breakouts.
- Check various time frames to align with market trends.
- Set stop-loss orders and establish risk-reward ratios for managing risks.
Understanding Breakouts vs False Breakouts
How can you tell the difference between breakouts and false breakouts in trading?
Breakouts are when prices move out of a set range, suggesting a potential change in market direction.
On the other hand, false breakouts happen when prices briefly go beyond a range but then fail to keep moving in that direction, trapping traders in losing positions.
To distinguish between the two, carefully study price movements, especially around important levels of support and resistance. Watching how prices behave near these levels can give hints about a breakout’s strength and validity.
Also, paying attention to trading volume can help confirm if a breakout is real, as strong volume often accompanies true breakouts.
Key Strategies to Avoid False Breakouts
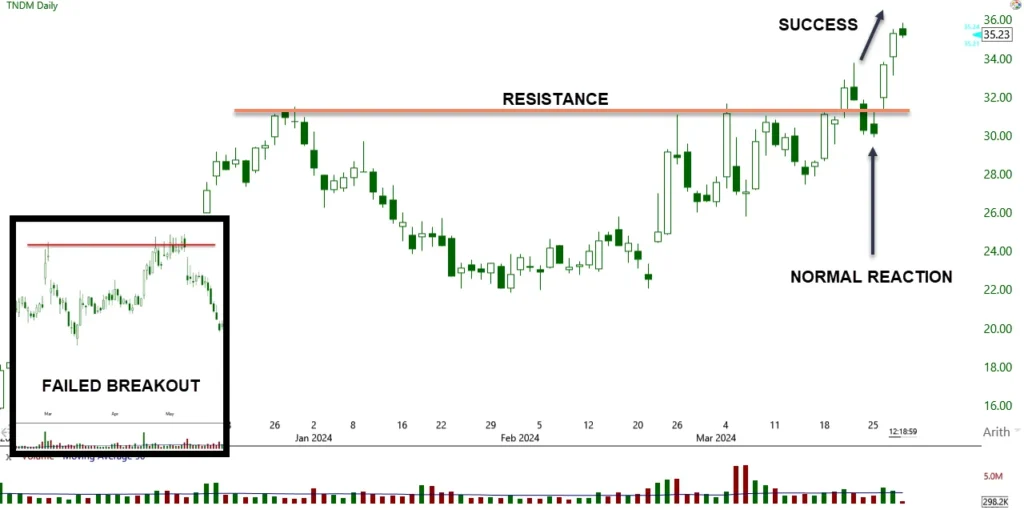
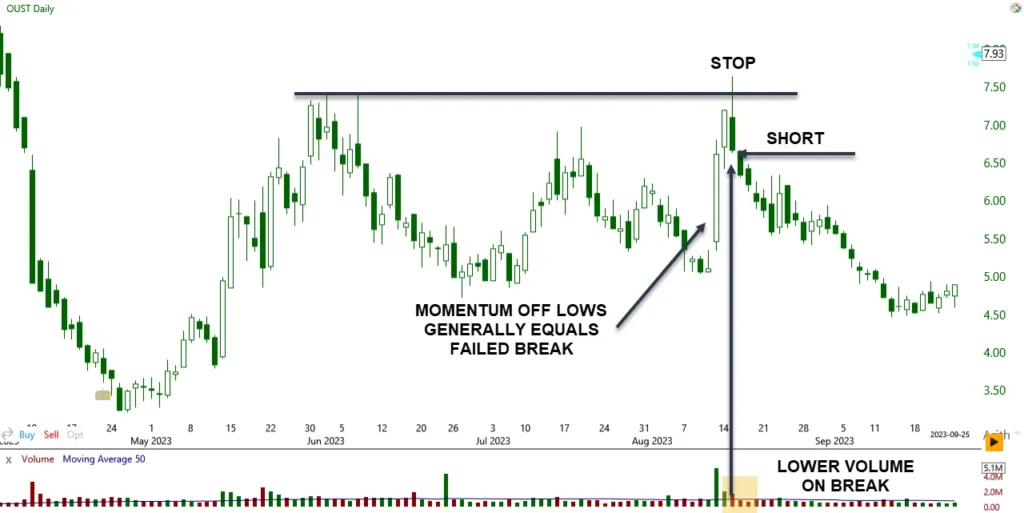
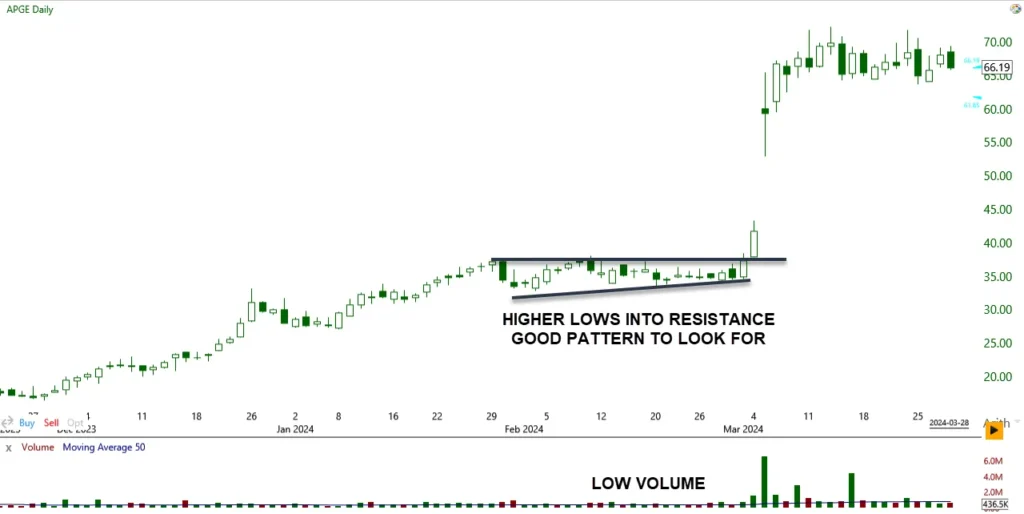
To become skilled at avoiding false breakouts in trading, you should use key strategies that rely on confirmation indicators such as moving averages and volume indicators to validate breakouts. Price action is also important as is where the breakout originates from. Breakouts that originate from the bottom of a range with one or two bars, generally fail.
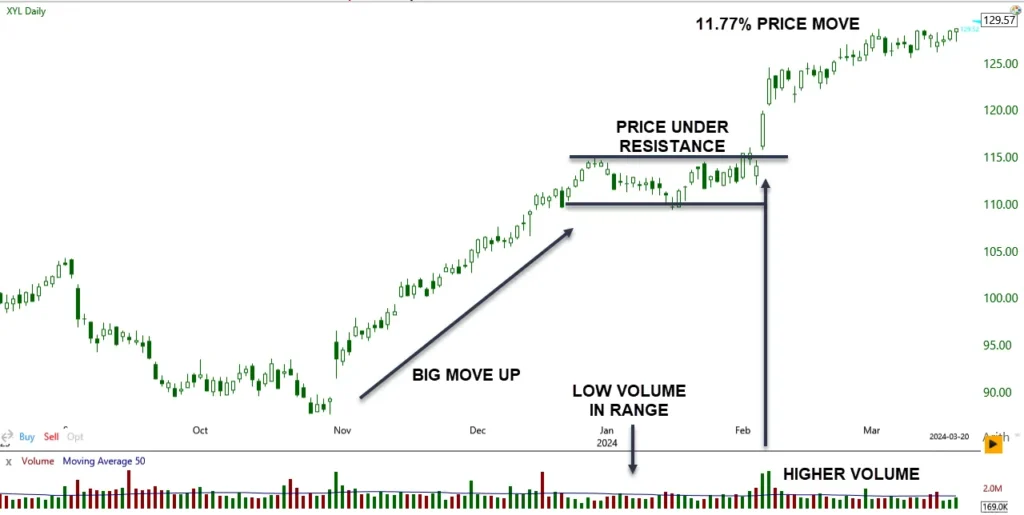
Finding setups where the price is based under resistance for a long or above support for a short, leads to a higher probability of success
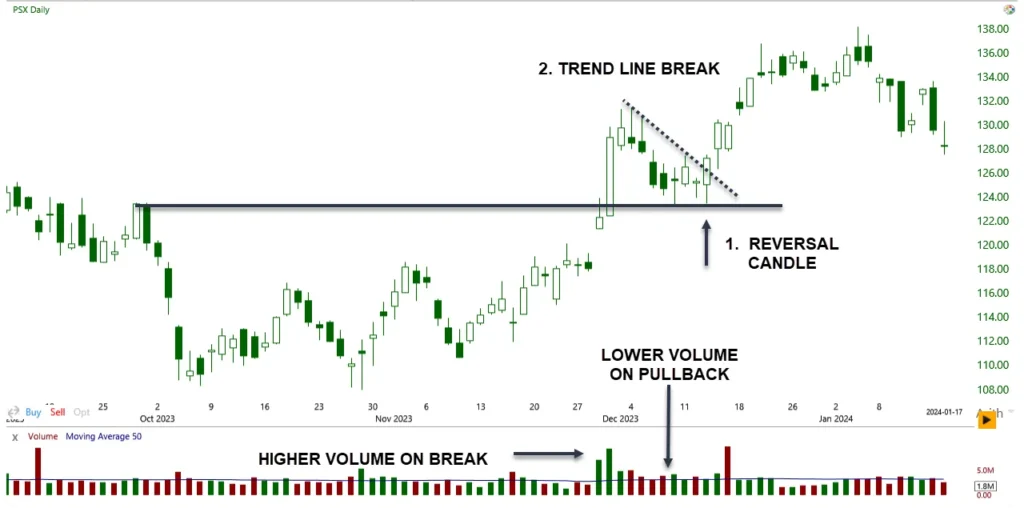
It’s important to wait for candle closes to confirm breakouts, which helps prevent making early entries based on price fluctuations within a candle. Keep an eye out for retests and follow-throughs after breakouts to confirm sustained momentum and filter out false signals.
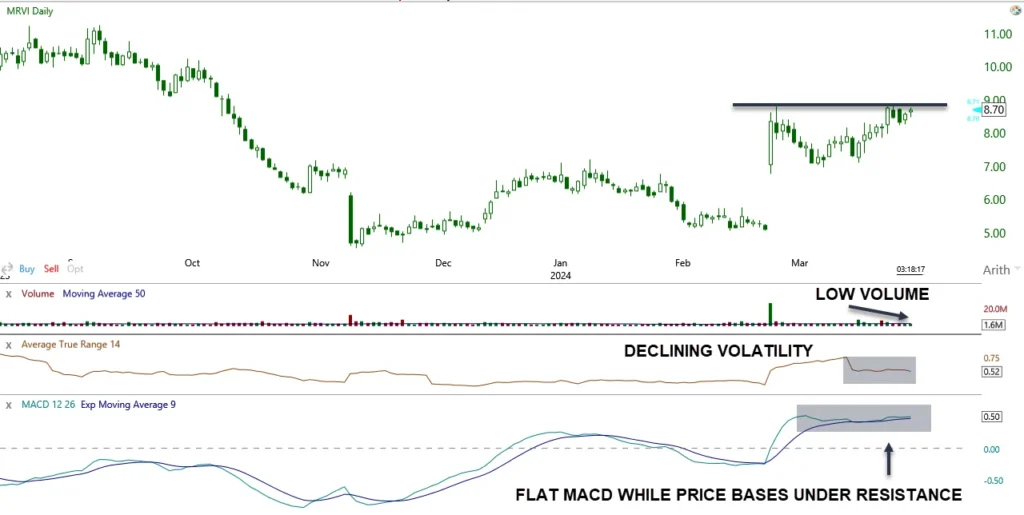
Several great things with this chart: flat MACD, declining ATR volatility, low volume, and price basing under resistance. This points to a higher probability of a successful breakout. It can fail, but the odds increase.
It’s also beneficial to analyze multiple time frames to align with the market’s overall direction and reduce the risk of false breakouts. Implement stop-loss orders and establish risk-reward ratios to effectively manage trade profitability and safeguard against losses from false breakouts.
These were several examples of what you should consider looking for before thinking about trading a breakout from a range or chart pattern.
Advanced Tactics: Trading on False (Failed) Breakouts
Trading on false breakouts means taking advantage of price reversals by buying low after a breakout fails and selling high. A breakout indicates a possible change in price movement beyond established support and resistance levels. However, false breakouts can deceive traders into entering trades too early.
To trade on false breakouts, you should wait for confirmation of the failed breakout before making a trade. This confirmation may involve observing price action patterns, like a quick reversal back within the support and resistance levels after the breakout attempt. By recognizing these false breakouts and acting on them, you can profit from the subsequent price movement in the opposite direction.
Remember to use proper risk management techniques and adjust the size of your positions to safeguard your capital when trading on false breakouts. By staying alert and patient, you can transform failed breakouts into profitable trading opportunities.
Tools and Indicators for Identifying False Breakouts
To spot false breakouts in trading, use tools like the MACD histogram and Average True Range (ATR) to detect narrowing market ranges, which could indicate potential deceptive breakout situations.
Here are three key tools and indicators to help you navigate false breakouts:
- MACD Histogram: Watch the MACD histogram for signs of volatility contraction. A flat histogram may indicate decreasing market volatility, a common signal of false breakouts depending on context (see previous chart).
- Average True Range (ATR): Use the ATR to measure market volatility levels. Avoid trading breakouts when ATR readings show high volatility, as this can heighten the risk of false breakouts.
- Strong Momentum: Exercise caution when initiating trades during strong momentum phases, as this can also lead to false breakout scenarios. High histogram readings on the MACD can act as a warning to avoid trading during potential false breakout situations.
The Psychology Behind False Breakouts
Understanding why false breakouts happen is crucial for improving trading decisions and reducing potential losses. False breakouts can be caused by market manipulation or a lack of sustained buying or selling pressure. Traders may rush into trades out of fear of missing out (FOMO), leading to premature entries that contribute to false breakouts.
Psychological factors such as herd mentality and emotional trading also play a significant role in false breakout situations. It’s important to acknowledge how these emotions and behaviors can influence market movements and result in false signals.
Manipulative tactics in the market can create fake breakouts, setting off a chain reaction of stop-loss orders and worsening losses. By staying informed and recognizing these psychological factors, traders can make more logical decisions, reducing the risk of falling prey to false breakouts.
Advanced Chart Patterns and False Breakout Scenarios
 Understanding complex chart patterns like double tops, head and shoulders, and wedges can be great for spotting potential false breakout situations. To avoid as many false breakouts as possible, it’s key to grasp the characteristics and formations of these chart patterns.
Here are three essential points to consider:
- Head and Shoulders Pattern: This pattern comprises a peak (head) flanked by two lower peaks (shoulders). A false breakout occurs when the price doesn’t dip below the neckline post the head formation, hinting at a possible reversal back into the pattern.
- Support or Resistance Level: Pinpointing support and resistance levels within complex chart patterns is vital. False breakouts tend to occur when the price briefly surpasses these levels but fails to maintain the breakout, indicating a potential reversal.
- Confirmation Through Multiple Time Frames: Evaluating complex chart patterns across various time frames can validate a breakout. By waiting for consistent price action confirmation across different time frames, false breakouts can be avoided before making trading decisions.
Risk Management Strategies in Breakout Trading
To better protect your capital and manage risk in breakout trading, consider using stop-loss orders. These orders help limit potential losses by setting them at key levels like support or resistance. Before entering a trade, establish clear risk-reward ratios to ensure that potential gains outweigh potential losses.
Properly sizing your positions is crucial in breakout trading to control the amount of capital at risk. Diversify your portfolio and avoid concentrating too much on a single breakout trade to spread risk effectively.
To further safeguard your profits and minimize losses in dynamic breakout situations, think about incorporating trailing stops. By following these risk management strategies, you can improve the overall performance of your breakout trading and shield your capital from significant downturns.
FAQ
What Leads to False Breakouts?
False breakouts occur when the price of a security breaks past a defined resistance or support level, but then reverses direction and fails to maintain momentum. This often results from insufficient trading volume, market sentiment shifts, or news events that temporarily affect price movements, misleading traders into believing a sustained price trend is starting.
How Can One Identify and Avoid False Breakouts?
To filter false breakouts, traders often use technical indicators like volume, moving averages, and relative strength index (RSI). A higher-than-average volume during a breakout suggests a genuine move. Additionally, waiting for a confirmation, such as the price closing above the breakout level, can help in avoiding premature entries.
What Differentiates a True Breakout from a False Breakout?
The key difference between a true breakout and a false breakout is sustainability. A true breakout sustains its direction beyond the resistance or support level, often accompanied by high trading volume and confirmation signals. In contrast, a false breakout reverses direction shortly after crossing the key level, lacking substantial volume and follow-through.
What are the Consequences of a False Breakout?
Following a false breakout, the price of the security typically returns to its range within the support and resistance levels. This reversal can lead to quick losses for traders who entered positions based on the breakout, especially if they don’t use stop-loss orders to mitigate risk.
How is a False Breakout Characterized?
A false breakout is characterized by the price of a security moving past a key resistance or support level, followed by a swift reversal back within the original range. This movement is often accompanied by low trading volume and a lack of confirmation signals, making it appear as a short-lived, unconvincing break of the price level.
What Constitutes the Candle Breakout Strategy?
The candle breakout strategy involves identifying a breakout based on the formation of specific candlestick patterns. This strategy looks for candles that close above resistance or below support, indicating potential entry points. Traders might combine this with other indicators like volume or moving averages for confirmation.
What is the Essence of the 5-Minute Breakout Strategy?
The 5-minute breakout strategy is a day trading technique that involves identifying breakouts on a 5-minute chart. Traders look for the price to move beyond a defined range or past key levels of resistance or support, often within the first few hours of trading, and enter trades in the direction of the breakout.
What Does the 2 Candle Rule Entail?
The 2 candle rule in trading suggests that a genuine breakout is confirmed when two consecutive candles close above a resistance level or below a support level. This rule helps traders to confirm the strength and sustainability of a breakout before entering a trade.
How Does the 5-Min Candle Breakout Strategy Work?
The 5-minute candle breakout strategy involves identifying breakouts on a 5-minute chart where a candle closes significantly above a resistance or below a support level. This strategy is often used in day trading, where traders look for quick movements and enter positions for short durations.
Conclusion
Mastering the skill of avoiding false breakouts is crucial for successful trading. By focusing on identifying patterns, utilizing strong candlesticks, and analyzing various time frames, you can improve your ability to identify real breakouts.
Remember to wait for clear candlestick closures near important levels and examine smaller patterns within larger ones for a comprehensive view. With a strategic approach and proper risk management, you can navigate breakout complexities with confidence and precision.