- April 27, 2023
- Posted by: Shane Daly
- Category: Trading Article

Trading stocks can be a challenge, even for the most experienced trader. But with the right tools and strategies, you can find consistent success. One of those tools is the moving average – one of the oldest and most commonly used technical indicators in the stock market today.
In this blog post we’ll discuss what a moving average is, different types of moving averages available to traders, how to use them effectively as part of your strategy for successful trading results, their benefits and drawbacks when it comes to using them – all so that you have an understanding on “the best way to use a moving average”.
What is a Moving Average?
A moving average is a technical analysis indicator that helps smooth out price action by filtering out the “noise” from random price fluctuations. It does this by taking the average of a certain number of past price points and plotting it as a line on a chart. This line is then used to identify trends, “support and resistance levels”, or even potential trade entry or exit points for trades.
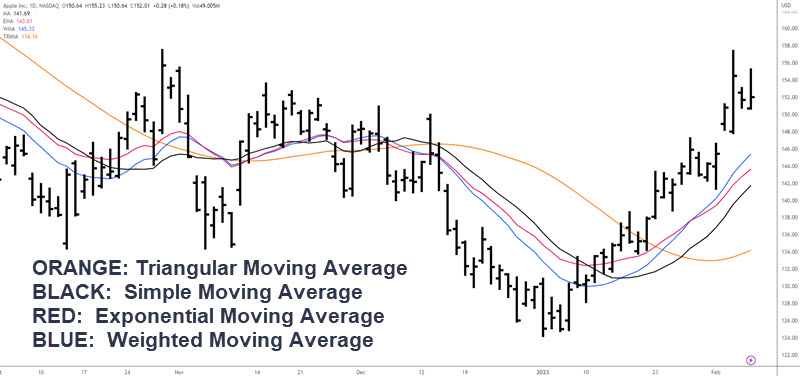
There are several types of moving averages available, each with its own characteristics when it comes to the calculation.
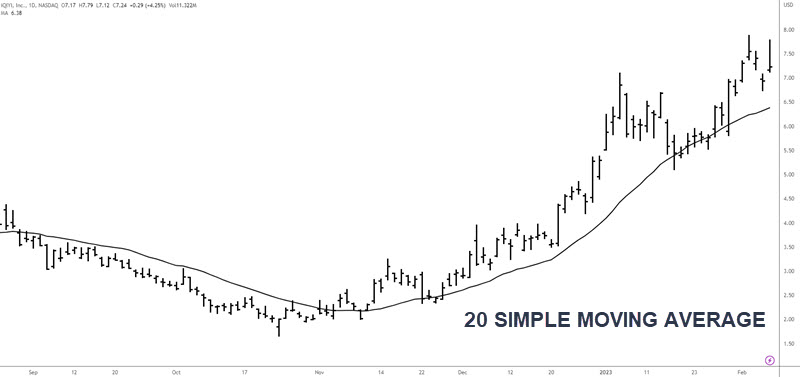
The most common type is the simple moving average (SMA), which takes the average of all data points in an interval over a given period of time. For example, if you have 20 days worth of closing prices for stock IQ and want to calculate its SMA over those 20 days, you would add up all 20 closing prices and divide them by 20 to get your SMA value for that day.
 Other types include exponential moving averages (EMAs) which give more weight to recent data points than older ones;
- Weighted moving averages (WMAs) which assign different weights to different data points
- Hull Moving Averages (HMAs) which use double smoothing techniques
How To Use Moving Averages
Traders use MAs as part of their overall trading strategy when they are looking at longer-term/shorter trends in order to determine whether they should enter into positions or not.
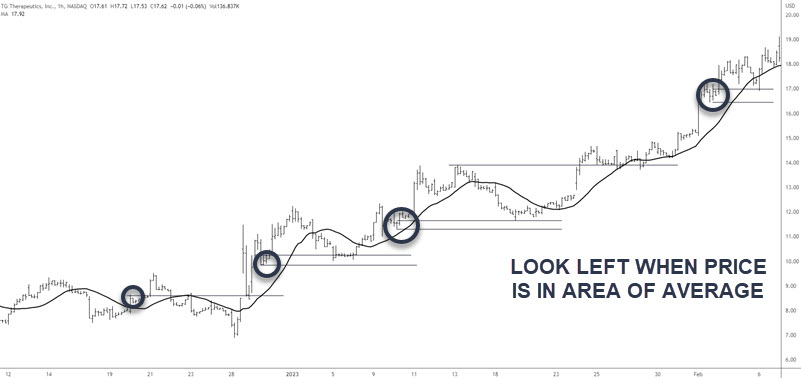
They can also be used as support/resistance levels however if you look to the left on the chart, you will often see a support or resistance price level or cluster.
Traders may also look at moving average crossovers between two different MAs – when one crosses above/below another – in order to signal potential buy/sell opportunities since these could indicate shifts in momentum.
 One major benefit associated with using MAs is that they help reduce noise caused by short-term volatility so traders can better focus on long-term trends without getting distracted by minor fluctuations in the price action.This is dependent on the length of average you are using.
Some traders find success using multiple MA’s together along with other indicators such as RSI, MACD, Stochastics etc., so there are plenty of ways you can customize your trading approach.
Types of Moving Averages – Deeper Look
A moving average is simply an average of the closing prices of a security over a certain period of time, usually between 10 and 200 days. The longer the period, the smoother the line will be on your chart. There are several types of moving averages that can be used depending on your goals and trading style.
| Type of Moving Average | Description |
|---|---|
| Simple Moving Average (SMA) | Commonly used by traders, it gives equal weight to all data points in its calculation. |
| Exponential Moving Average (EMA) | More sensitive than SMA, it assigns more weight to recent data points. |
| Weighted Moving Average (WMA) | Assigns different weights based on how close data points are to current price action, reacting quicker to price changes. |
| Triangular Moving Average (TRA) | Combines weighted and simple averaging calculations, assigning higher weights to middle values and smoothing out shorter-term volatility. |
Moving averages can be used in different ways to help traders make better decisions, and understanding the types of moving averages available is essential for any trader. In the next section, we will look at how to use moving averages effectively.
How to Use the Popular Moving Averages
The moving average crossover is a popular trading strategy used by many traders. It is based on the idea that when two different moving averages cross, it signals a potential trend change in the instrument.
A buy signal occurs when the shorter-term (faster moving average) crosses above an already rising longer-term or slower moving average. On the flip side, a sell signal occurs when the shorter-term or faster moving average crosses below a falling longer-term or slower moving average.
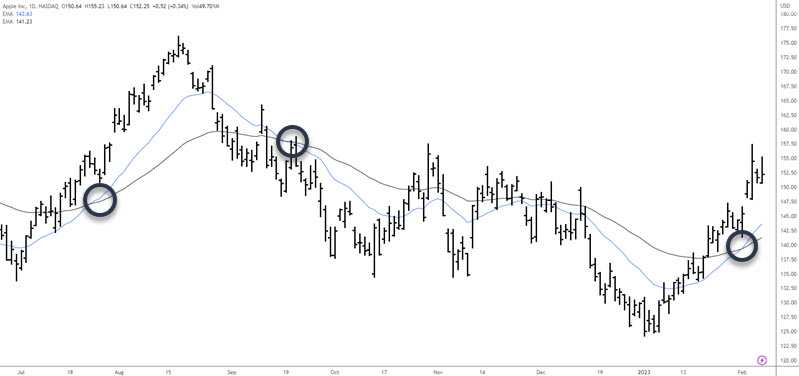 Traders can use this system to identify buying and selling opportunities in any stock.
For example, if you are looking at AAPL and notice that its short term (20 period) simple moving average has crossed above its long term (50 period) simple moving average, then this could be interpreted as a buy signal for AAPL or at least a bullish move.
On the other hand, if you see that AAPL short term (20 period) simple moving average has crossed below its long term (50 period) simple moving average then this could be interpreted as a sell signal for AAPL .
It is important to remember that no matter what type of trading strategy you use – whether it involves using technical analysis tools like Moving Averages Crossovers or fundamental analysis – there will always be risk involved with investing/trading in the financial markets and so proper money management techniques should always be employed when trading with real money.
Benefits of Using Moving Averages
They provide an objective view of the market and can help traders identify potential areas where prices may reverse or consolidate before continuing in their current direction.
One of the primary benefits of using moving averages is that they allow traders to quickly spot changes in price trends. By plotting a line on a chart, it’s easy to see when prices have moved above or below the average and this can indicate whether momentum is increasing or decreasing.
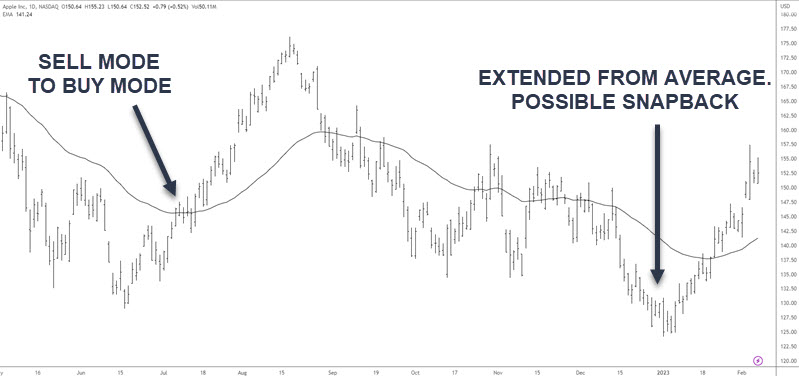 Another benefit of using moving averages is that they make it easier for traders to identify entry points into trades with greater accuracy.
When prices move above or below the average, it often signals either an uptrend or downtrend which could present trading opportunities. Similarly, if prices remain within a certain range near the average then this could signal consolidation which might also present trading opportunities depending on how far away from the average prices move during periods of consolidation.
Drawbacks of Using Moving Averages
The first major drawback of using moving averages is that they are lagging indicators. This means that they will not always accurately predict future price movements since they are based on past data points.
For example, if the current trend in the market is up but the moving average shows it going down, this could mean trouble for traders who rely solely on this indicator as it may not reflect the true direction of prices.
Another issue with using multiple types of moving averages at once is that conflicting signals can occur, which can confuse traders instead of helping them make better decisions about their trades. For instance, if two different types of moving averages show different trends then it can be difficult to know which one to trust or follow when making trading decisions.
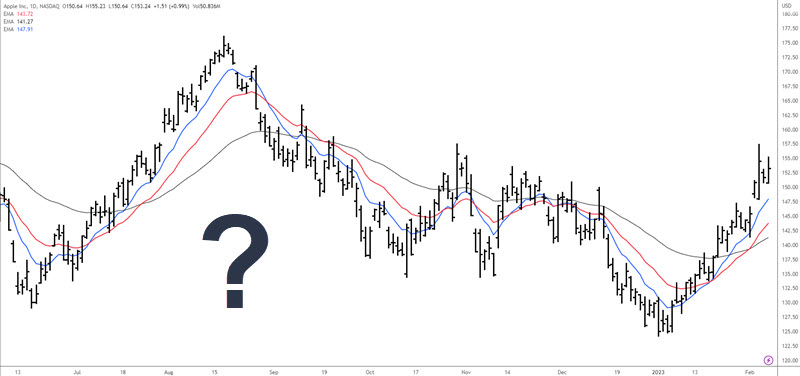 Finally, another disadvantage of using moving averages is that they don’t take into account other factors such as news events or economic data releases which could have an impact on prices in either direction over time and therefore affect how reliable these indicators really are when trying to predict future price movements accurately.
FAQs in Relation to What is the Best Way to Use a Moving average
What is the most accurate moving average?
The most accurate moving average depends on the individual trader’s trading style and goals. Generally, longer-term moving averages such as the 200-day or 50-day are more reliable than shorter term ones like the 10-day or 20-period. These longer time frames can help traders identify long term trends in a stock’s price movement. On the other hand, shorter periods may be better suited for day traders who want to take advantage of short term fluctuations in a stock’s price action.
How to use 5 8 13 Ema?
The 5 8 13 exponential moving average (EMA) is a technical analysis approach to identify trends in the stock market. It works by taking the average of the closing prices over a certain period of time and plotting them on a chart. The 5 8 13 EMA uses three different EMAs with different lengths: 5, 8, and 13 days.
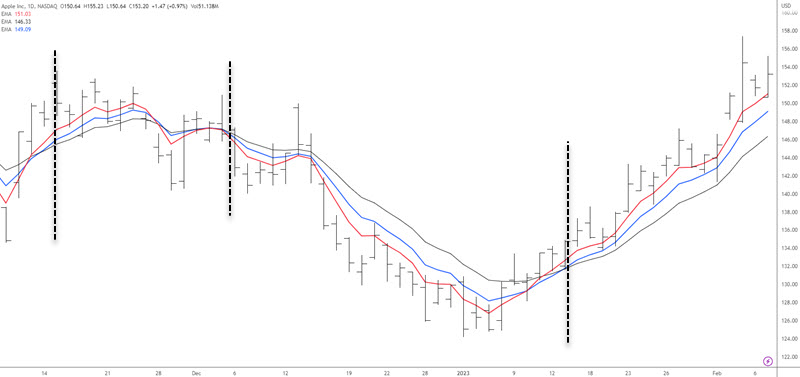 When these lines cross each other or when one line moves above or below another line, it can signal either an uptrend or downtrend in the instrument being considered. Most traders will look for these lines to be trending in the same direction in an orderly way – as seen on this chart.
Conclusion
In conclusion, the best way to use a moving average is to understand its components and how it works. By understanding the pros, cons, and the calculations, traders should test the best way to use them that fits their trading objectives. I personally uses them to spot consolidations when price is whipping around the averages.
Moving averages are an effective tool for traders who want to analyze trends in stock prices to ensure they are trading a trending market. It can be used as part of a trading strategy or on its own, depending on the trader’s goals.
While there are some drawbacks associated with using moving averages, such as lagging indicators and false signals, they remain one of the most popular technical analysis tools available today. With practice and patience, traders can learn how to effectively use this indicator to maximize their profits in the stock market.

