- March 30, 2022
- Posted by: Shane Daly
- Category: Trading Article
If you are a trader that focuses on technical analysis, you have probably seen many chart patterns over the years. Chart patterns can be used to effectively trade but it does take screen time to quickly find them and trade them successfully.
Traders like to find the “best” of everything but the truth is that just like everything else, there is no best chart pattern. They all have a use and represent the underlying buying and selling pressure of the instrument. As the pattern takes shape, you can see which side, buyers/sellers, are carrying the most weight in the recent price movement.
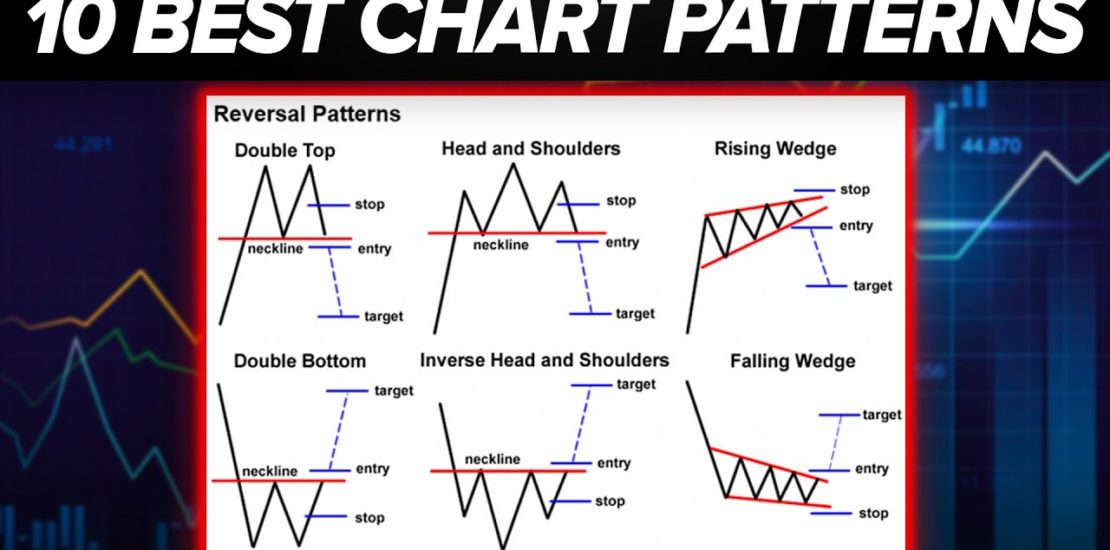
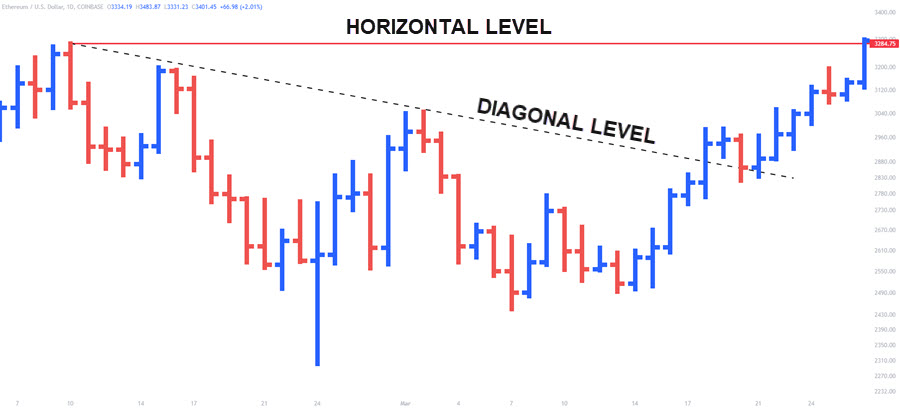
Each pattern is some take on support and resistance. While most traders are used to horizontal levels, many patterns will include diagonal levels using trend lines as well. The diagonal ones are in tune with the rhythm of the market swings while horizontal levels are swing levels.
 + Resistance Level: Areas where price movement is halted to the upside
+ Support Level: Areas where price movement is halted to the downside
You will decide if you will use the real body or the highs and lows of each price plot. For me, I use the highs and lows because price did plot at those levels. It’s also a rigorous way to ensure you are consistent with every price chart.
There will be times that price rejects precisely at these levels but that is more the exception than the rule. Expect to see some price movement around these levels which are better described as price zones instead of exact price points.
Types Of Chart Patterns
Patterns come in three different categories:
Continuation pattern: Gives a trading signal that price is going to continue in the direction of the trend. These are pauses in price movement while the previous price move is being digested by traders. There is a common belief that the longer price builds in a continuation pattern, the further price will run when the pattern is broken.
Trend Reversal pattern: A sign that the trend direction may reverse. When looking for a reversal, besides a chart pattern, you do need a reason to think price is setting up a market reversal. Look for some type of exhaustion in the price movement usually seen with larger than average price bars/shadows.
Bilateral Chart Patterns: These are patterns where there is an expectation of a signal in both directions. Traders will often trade these in the direction of the trend as a higher probability setup.
Even though your chart pattern will fit into one of these categories, there is no guarantee that is how the pattern will resolve. There are some things to look for, which we will cover, that puts the odds in a certain direction, but that can fail.
Chart Patterns You Should Know
To outline these patterns, I will do so with both long and short variations. I won’t break them down via categories and you will probably find one that speaks to you. As an example, I don’t read the head and shoulders pattern very well but I do read the flag patterns quite easily. In fact, the head and shoulders pattern appears all throughout a trending market and I just find them unusable. I don’t even look for it.
Let me also add that these patterns also appear in random data.
If you are trading these patterns without context, it’s no better than flipping a coin. I believe that understanding the imbalance that is occurring is more important that just finding that pattern and trading it. We aren’t trading the pattern, we are trading the imbalance.
Triangles
There are three different types of triangles a trader should pay attention to.
Ascending Triangle – Bullish Continuation Pattern
The feature of this bullish triangle is higher lows into a defined resistance zone. This pattern will have at least four identifiable price points.
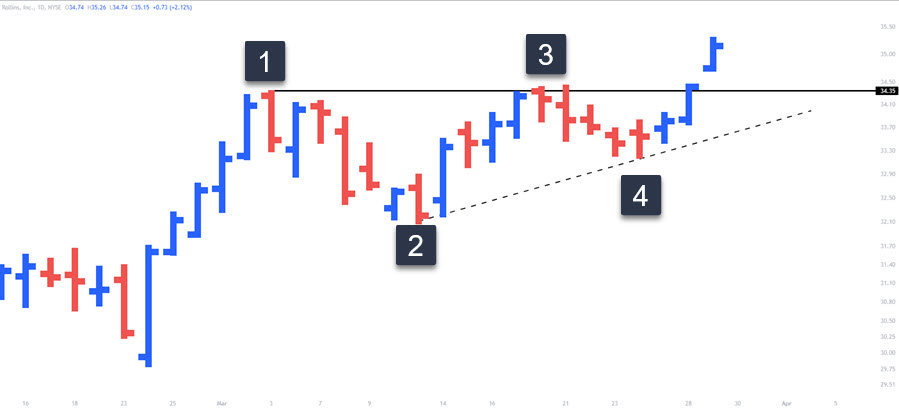
While price is failing to make new highs at label three, buyers are stepping in at higher prices at number four. This is a sign that sellers can’t overwhelm the buyers and higher prices are not deterring the buyers as there is strong demand for the instrument. The general entry trigger is a break of the resistance zone although earlier entries may present themselves depending on how price develops.
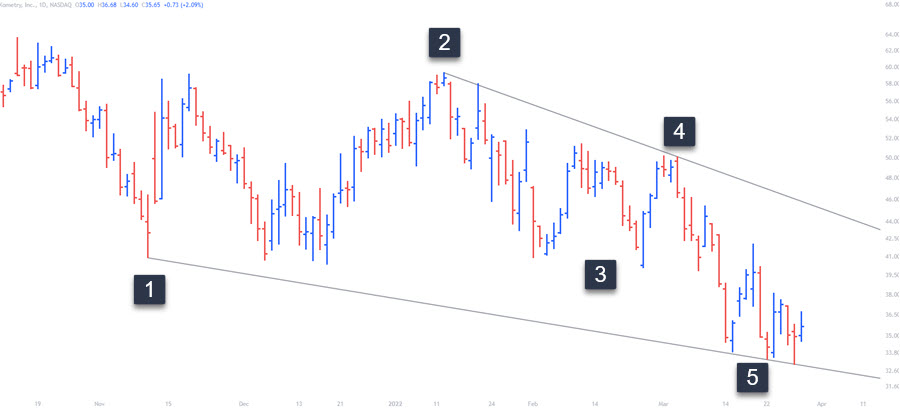
Descending Triangle – Bearish Continuation Pattern
The opposite of the ascending, we are looking for prices to make lower highs into a defined support zone. This is a good example of chart patterns not always being clean but remember, it’s the concept and the imbalance we are trading.
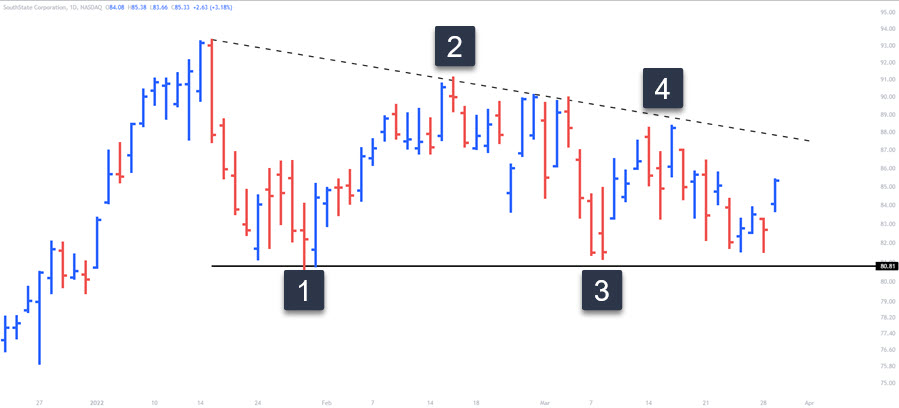
The selling pressure into support is showing the demand for the instrument is not as strong and traders are willing to dump their position at cheaper prices. Like the previous triangle, traders can use a diagonal trend line to connect points two and four. Traders will look for a break of support to initiate a position to the downside.
Symmetrical Triangle Pattern – Continuation
This pattern is generally considered a continuation pattern however it is not as strong as the other triangle patterns. The imbalance of buyers and sellers is not as prevalent as we see higher lows and lower highs for example.
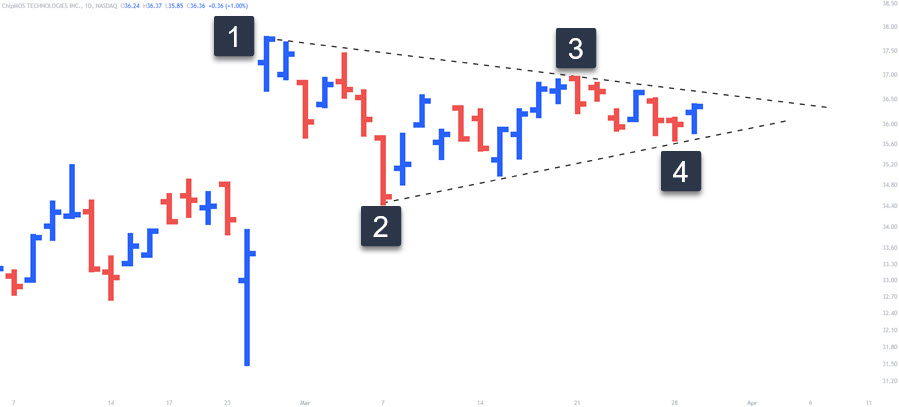
You will generally see price action coiling up into the apex (where the two trend lines meet) and an explosion from the pattern. Fading these moves out of the pattern are not advisable as statistically, the triangle break will be a sustainable run.
These patterns can form in a short time as seen on these daily charts or form a much larger pattern. Since you need four points to consider the pattern, you will need at least four period to elapse (such as four days using daily charts) before you can define the pattern.
Rectangle – Continuation (Bilateral chart pattern)
This is a very common pattern and can suit range traders or those looking to trade breakouts. You will generally want to trade these in the direction of the trend that leads into the pattern.
When I see an instrument with this pattern in an uptrend, I can trade a move off the bottom support zone and depending on price action, hold for a break or take profits. Again, look for at least four points to define the pattern. It does not have to be perfect and this pattern, like all of them, should jump out at you.
If during the formation of the of this pattern you start to see the trend lines converge at the far right edge, some traders may consider it a pennant pattern.
Even if you don’t trade this formation, it does give information about the condition of the instrument. It is not trending and if you are a trend trader, you’d quickly move onto another selection.
Flags
This pattern comes in two variations and the best ones come after a strong move in price. Also, the higher the flag forms in an uptrend thrust for example, the more powerful it can be.
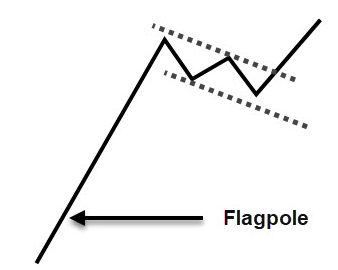
Traders that bought on the thrust, often called the flag pole, are holding positions during the flag formation. Not enough sellers/shorts are entering to push price down therefore, the pattern forms near the high of the thrust.
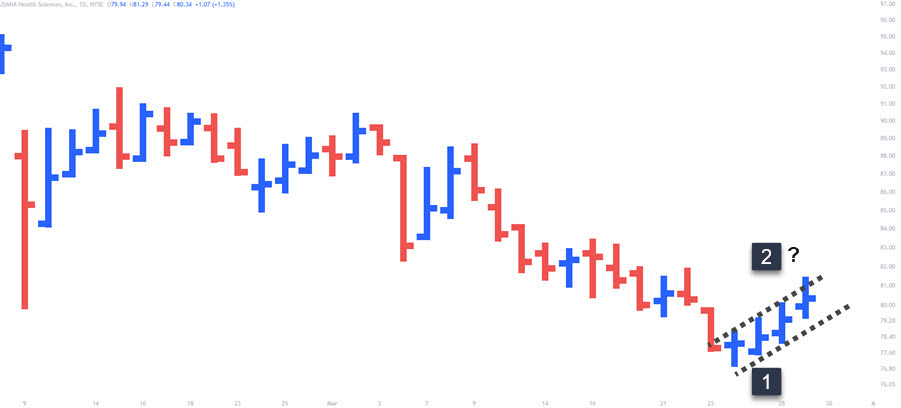
Bull Flags – Continuation Pattern
These are my favorite patterns to trade both long and short. Not all flags will have four obvious points and I repeat, it is the concept and the underlying pressure we are trading.
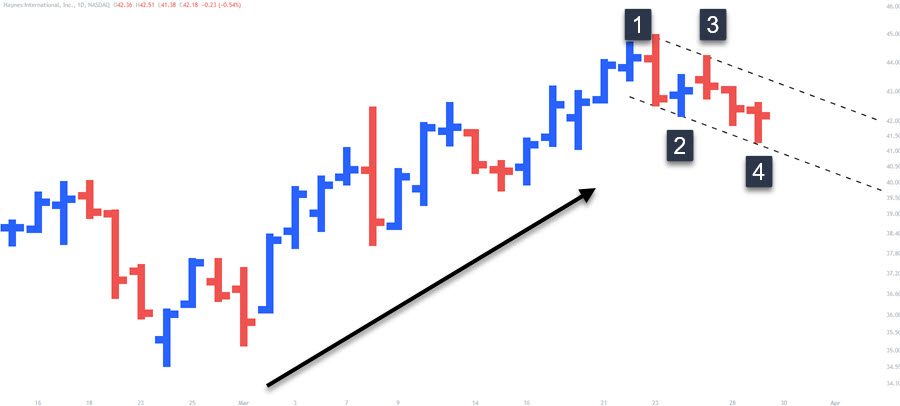
The flag will represent profit taking between 1 and 2. Buyers step in to bring the price up at 3 but sellers/profit taking sets back in bringing us to number 4. This pattern may not always be an obvious 4 swing pattern.
Bear Flags – Continuation Pattern
We have a move down in the price of the instrument, There is some profit taking or buyers stepping in but not enough to change the trend.
Notice that this example has consecutive higher lows and higher highs as price continues to form the second part of the swing.
The key to trading flags is during the formation, we do not want to see momentum stepping in against the main trend direction. Look for a lazy pullback and an obvious resumption of the previous trend for your entry. A strong initial thrust into the pattern and then lazy price action is acceptable.
When a strong move occurs that does not entice other traders into the move, you can often expect price to reverse.
Support Zone – Holding or Failing
Well technically not a chart pattern at first, this is probably the first thing a trader learns – support and resistance. I include it because, depending on how price reacts, it can form a tradeable pattern.
When price is moving lower, it will come into a price zone where further downside is halted. At this point, traders are looking for support to break (continuation) or support to hold (reversal).
Remember that the context matters:
+ If support holds in an uptrend after a pullback in price as an example, we’d call it a support holding trade and a continuation of the uptrend.
+ If price comes to support in a downtrend, support holds and an uptrend forms, it’s a reversal
+ If price breaks support in a downtrend, it’s a continuation
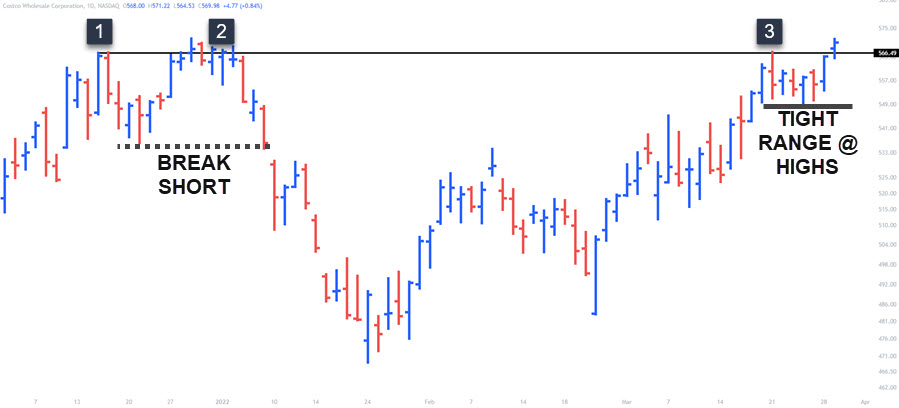
This example is after a big uptrend in price. While many of you are saying “that is a triple bottom”, you don’t know that at point 1 or point 2. What we do know is price reversed at number one and bounced. We know that we now have potential support at that price zone and need to see if support actually exists when/if price returns to the zone.
As price is approaching number 2, you’d look for a bounce (continuation) or a break of the line and a retest to short (reversal).
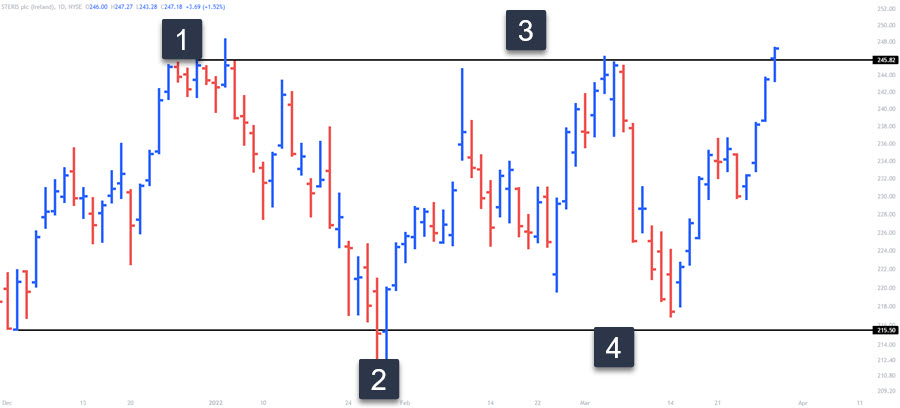
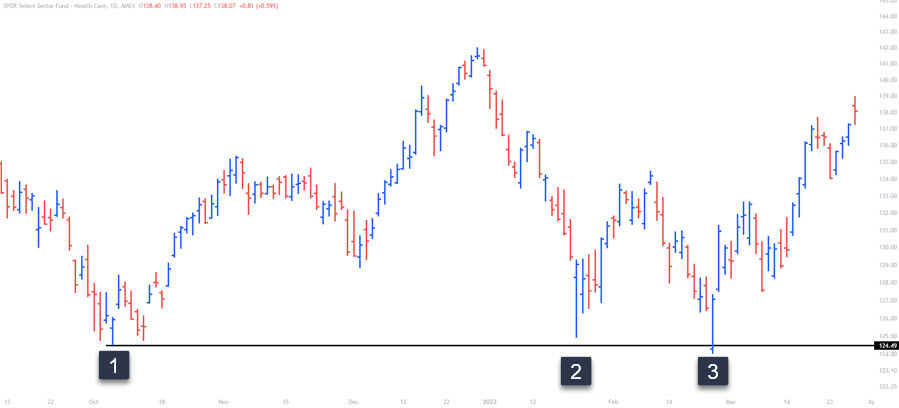
Resistance Zone – Holding or Failing
The same thoughts about context applies to the resistance zone. Let’s dig a little more into this chart as there are some good lessons present.
Number 1 forms our initial turning point and at number two, we have a successful double top form. It is successful because price failed to maintain highs as resistance held. Notice that price pushed from the lows into the break at number two subsequent to the collapse.
At number three, price forms a potential triple top but there is a difference between two and three. At three, we have a tight range form just under resistance which is bullish. Statistically, we would expect resistance to fail and for price to continue to the upside.
Trading Support or Resistance Zones
If you choose to trade these structures, you can choose reversals if the levels hold, or breakouts. Many traders will watch for a pullback after the breakout and look to enter on a lower time frame after a slight pause or pullback to the breakout zone. You can learn about trading support and resistance here.
Wedge Reversal Chart Pattern
These patterns use diagonal trendline and are reversal patterns. When drawing the lines, they go against the main trend direction which can confuse some traders.
Rising Wedge Pattern – Bearish Reversal Pattern
The rising wedge is found in a downtrend but the shape of it and the angle of the ascending lines fools some into thinking it’s a buying opportunity.

This instrument is in a downtrend and although we see a strong move off the lows, price is not showing the same momentum as it heads higher. One thing to notice is the upper trend line is sloping at less of an angle than the lower line. Eventually, for this pattern to be successful, we want to see price break through the lower trend line back in the direction of the down trend.
Falling Wedge – Bullish Reversal Pattern
Two descending trend lines are drawn to make up this pattern that forms in a bullish market. This particular example has evolved which is noticeable due to the lack of anchor point at number 3. However, the reversal at number three is important to note. Patterns won’t always make a perfect formation, but they don’t have to.
Is the upper resistance line falling at a greater angle than the support trend line? If so, the imbalance is present in the instrument and we can be on the lookout for a breakout to the upside.
How To Enter Chart Patterns
There are a few ways to enter one of these top chart patterns and much will depend on how much confirmation you want to see.
Before The Breakout
This was mentioned during the section on resistance zones where you’d look for price to base just under resistance (or above support) and enter prior to the break.
Another method is to look for a failure test of the support or resistance zone of the chart pattern.
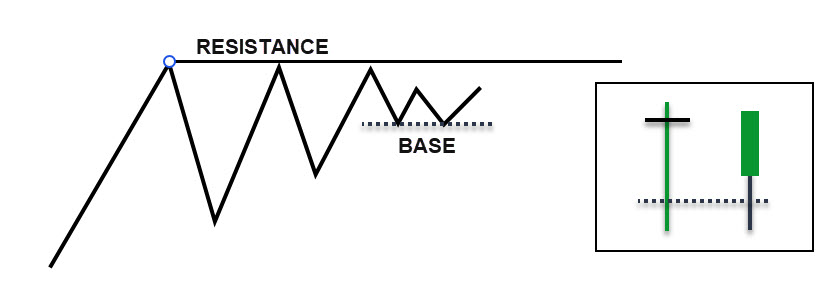
Using the ascending triangle as an example, if there is a base that forms under resistance, you’d look for a test of the lows of the base and then rejection. Entering early, while increased risk of a failure, does have the benefit of the breakout carrying you into profit.
At The Breakout
There are times that price breaks out and runs. Entering at the point of the break, either manually or with a pending order, does give you confirmation of the break.
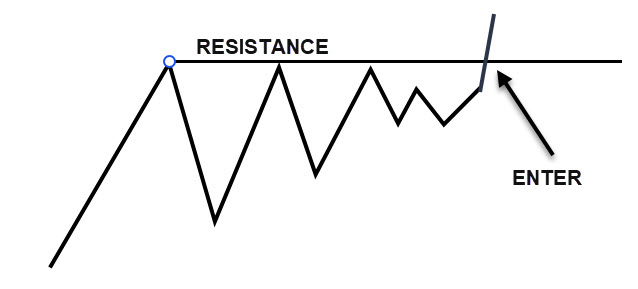
Setting a buy stop order at the resistance point of this chart pattern can be considered “set and forget” trading. Just make sure you find a place to set your stop. If there is a small base as in the diagram, below that is an option. Some traders will look for increased volume at the break and some traders will look to enter near the close of the session if price is going to close near the high of the day. Whatever you choose, just be consistent.
Breakout Pullback
Price can breakout and retrace back to test the former resistance level. You want to see it act as support when price revisits during an upside breakout.
Remember support and resistance are zones of price, not a precise point. Setting your stop just under the breakout point is a mistake as price reaching inside that point, is normal.
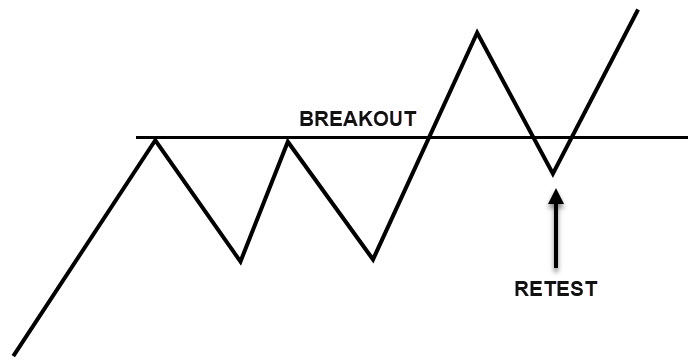
Traders would look to enter on the retest and reversal from the tested zone. A knowledge of reversal candlesticks can be helpful but essentially, we are looking for a strong bullish candlestick.
Bottom Line
All these technical patterns show the underlying strength in the instrument you are trading. While your eyes may not see the same things as another trader, you can make some basic rules for a pattern. One rule may be needing four obvious swing levels as shown in the flag pattern. There are many different trading strategies you can use with patterns.
Trading chart patterns must be done within the context of the previous price movement on your chart. Trading a pattern without an idea of what came before it, is a recipe for disaster.
Quick point about volume – some say to use it on breakouts and others say it makes little difference. Best thing is for you to test it over a large sample of trades and see if heavy volume has lead to greater success. Statistics haven’t ruled one way or the other. I personally don’t use volume in my own trading.
In the end, chart patterns show a pause in the advance of price – a consolidation of sorts. Support and resistance zones are formed and price will eventually have to break out to continue. Keep things simple. You don’t need to know the names of the all the chart patterns to find them useful. I simply consider them as consolidations in price and look for either the buyers or sellers to start to take over.
Further Resources
If you enjoyed this article about chart patterns, the following will enhance your ability to trade them successfully:
2 Comments
Comments are closed.
Thank you for these patterns. They are well illustrated! I appreciate it.
Thank you for this article, it will be very helpful to a confused trader. I have a life time subscription to Netpicks and it has helped me a great deal, This year tho the market is very hard to navigate .