- August 6, 2021
- Posted by: Shane Daly
- Category: Trading Article
There are many arguments for and against using chart patterns for trading.
The biggest one is how subjective they can be. I agree with that.
Chart patterns come in many shapes but there is one that I (and so many others) have found to stand the test of time.
Not only does it function well for day trading but swing and position traders can find it valuable as well.
In fact, you can design an entire groups of trading strategies around this one pattern.
What is it?
Trading Pullbacks
This is a very simple pattern that is found in the normal evolution of price.
A more precise description would be: trading the reversal out of a pullback.
Why should it work?
This is how price generally moves in an uptrend.
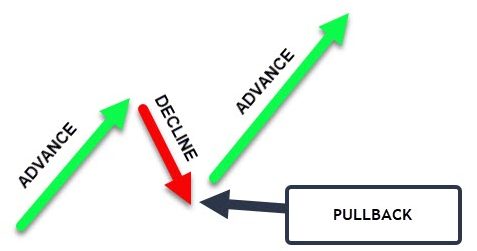 In a strong trend, we can expect price to break the previous high and continue to advance.
We can expect it to, until it no longer does.
The failure of price to advance is something we can use to determine if a pullback is even worth trading.
Is there some discretion involved? There can be. But you can also make your entire strategy rules based to avoid any bias that may crop up.
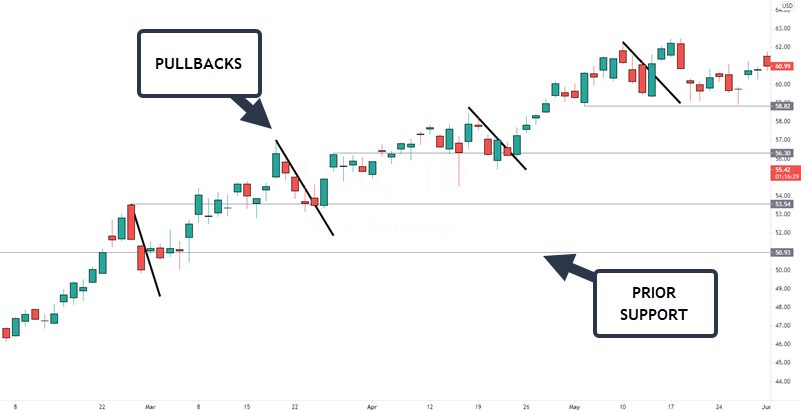
These pullbacks were chosen in seconds just by seeing real price declines and lower highs/lower lows with individual candlesticks.
The horizontal lines are simple previous swing highs/low or sideways consolidation.
Why did I use the horizontal lines?
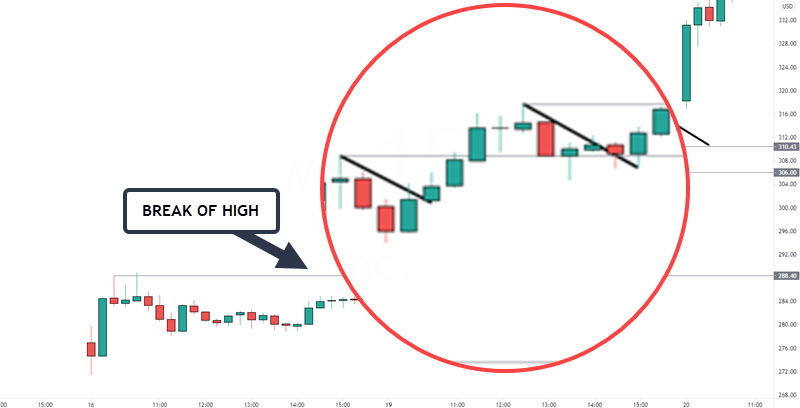
Look back at the first image in this article. If the lows start to break down, you can easily see that the price pattern is breaking down.
If the pullback starts to break those areas, you may want to skip that pullback.
Now is a good time to set some type of guidelines to trading pullbacks for both day trading and swing trading.
Rules Based Trading Strategy
If we are trading in a market that is moving up, we would want to see swing highs being taken out.
While we can use an overbought or oversold type of indicator, using price is an easier way to determine if a swing is worth trading.
Rule #1. Price must break a previous swing high to set up looking for a pullback.
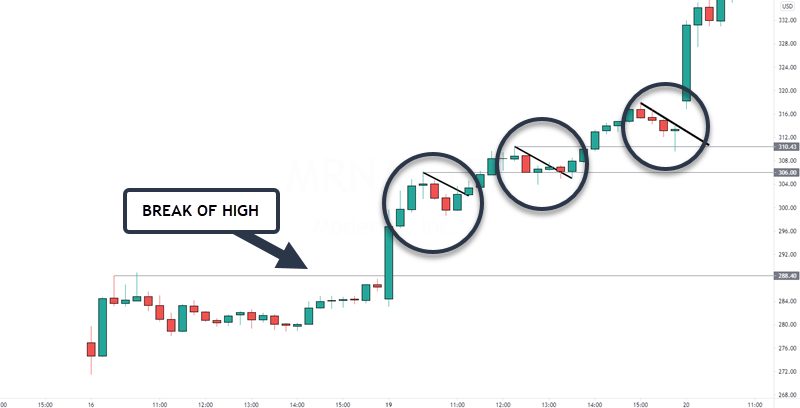
This is a 15 minute stock chart and price had broken the first swing high. This sets the stage to start looking for any decline in price.
Each of these pullbacks first saw price break the previous swing high making them official pullbacks for the strategy.
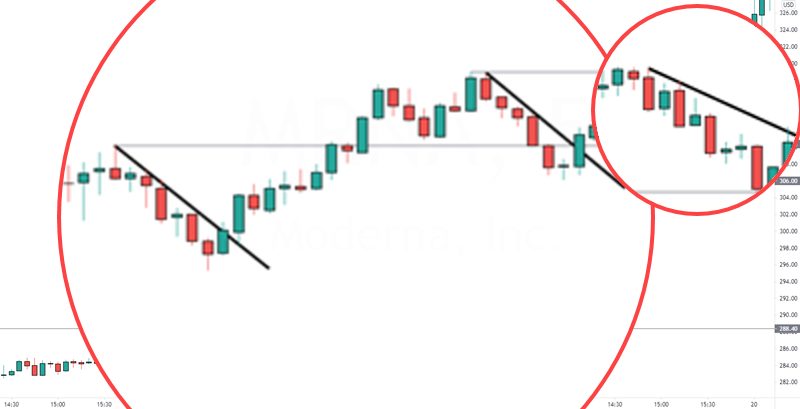
Rule #2. Draw the lines consistently
The lines for the pullback are not only a visual cue, but also can be used to determine an entry price.
In a perfect world, we would use each candlesticks high price and we would have multiple candles to use. It would make drawing them a littler easier.
You have several ways to draw a line that may make sense to you. Remember, the lines are not the pullback. They are a visual cue only.
Looking at our last chart, I simply had the line touching as many candles as I could without regard to the high of the candle.
Since I was using a 15 minute trading chart, in the next example, I dropped to a 5 minute chart to be a little more precise.
Does it make a difference?
Not really.
There is zero reason to make things more complex than they have to be.
Simply draw the lines to touch as many candles as possible.
Remember, we are not trading lines. We are trading price.
Rule #3. Trade pullbacks that respect the general direction of price
What this means is that if we are looking to buy, we need a market making new swing highs and lows.
If price breaks down below the previous swing high, while not a guarantee of trend failure, it does present us with a hurdle. Trading through potential resistance.
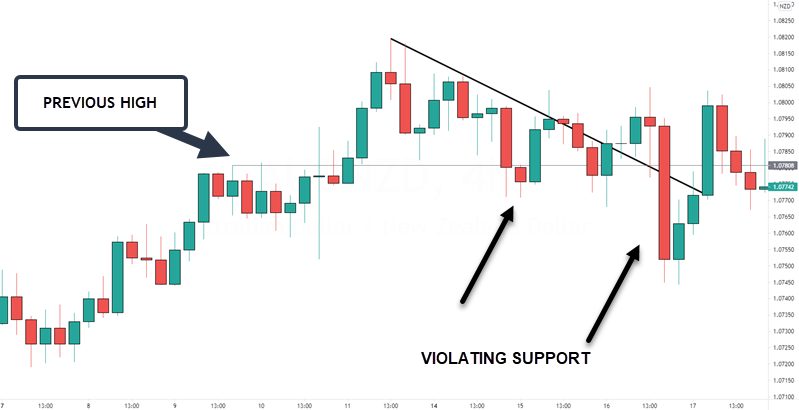
When we see price violating support, it is expected. At the same time, we would expect price to reject lower prices and begin to rise.
This chart shows the failure of price to advance.
Furthermore, the second violation with the red momentum candlestick should be a warning to stay away from this chart. Strong momentum in the decline phase is a red flag warning you to stay away. The current direction of price could be in jeopardy.
Rule #4. Use an entry trigger
Once you find a pullback that is viable due to the rules above, you need to decide how to enter a position.
Let’s look at 3 ways you can enter a trade that shows that price is, at least in the short term, looking to resume the upwards move for a buy.
- Breakout of previous candles
- Lower time frame range breakouts
- Using a moving average cross
Breakout of previous candles
This will tie in with breaking out over the line you have drawn. This is another reason why it is important to have consistency.
The reason for requiring a break of the line is to ensure the rhythm of the market has changed. If we just use a break of a candle high for longs, we may just be trading “inside” of the pullback.
Is there an edge? Maybe. You want to have odds in your favor and requiring a new high + a break of rhythm could do just that.
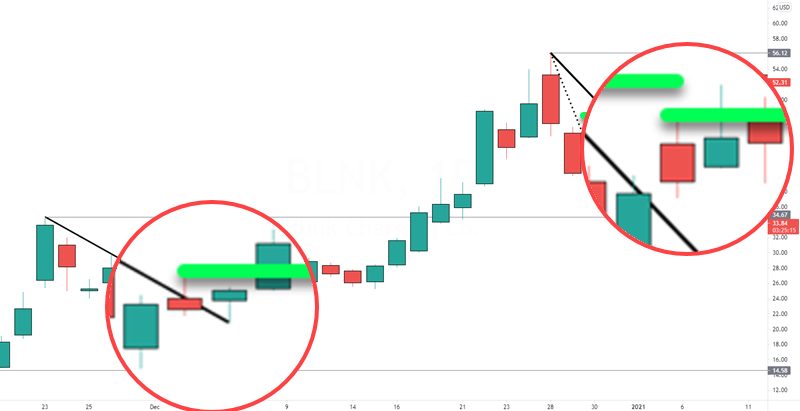
Lower time frame range breakouts
Bringing in a technique called multiple time frame trading with this one. All we are looking for is the pullback to occur and a lower time frame showing some basing. A breakout of the high of the base is the entry.
A general rule of thumb is to use 3-5 times lower than your trading time frame. For example, a 60 minute trading chart may use 15 minute entries. Daily charts in stocks may use daily chart setups and 1 hour entries.
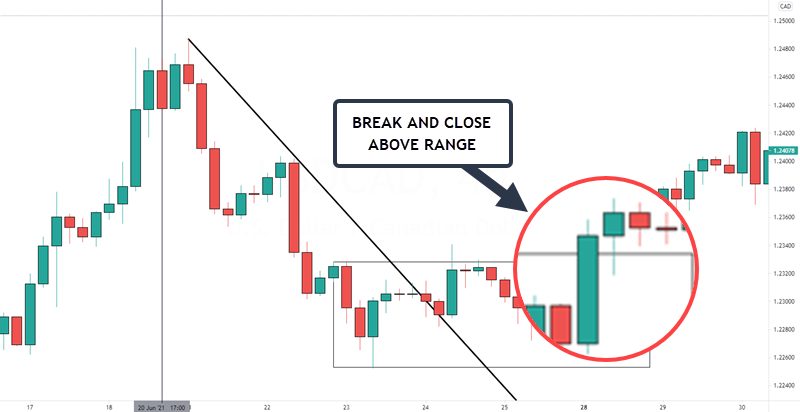
The trend line is drawn on the higher time frame chart. You would then go to a lower time frame and find a trading range.
Buying a break and close above the resistance zone is the general approach.
Using a moving average trigger
In this case, we will look for price to break above and close using a 5 EMA after pulling back below the average.
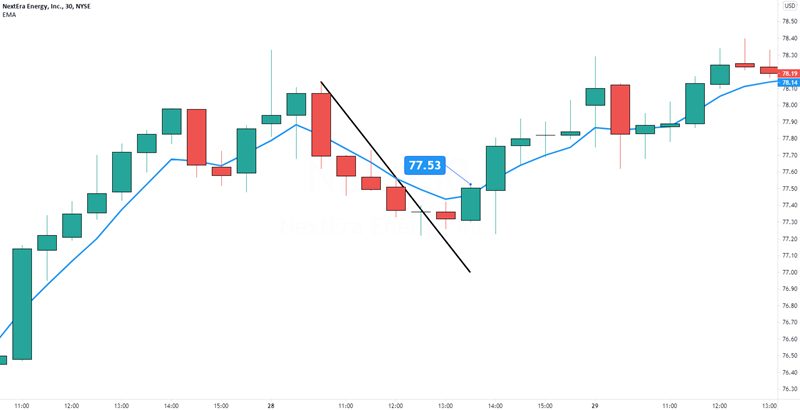
Price had a nice pullback completely below the moving average.
Once price breaks above and closes over the average, you can either buy stop the high or enter at close. One may suit you better than the other.
Trade Management With Pullbacks
One truth about pullbacks is you are entering below potential resistance.
This means that the previous swing level can give you an objective location to either take profits, adjust your stop, or scale out of your position.
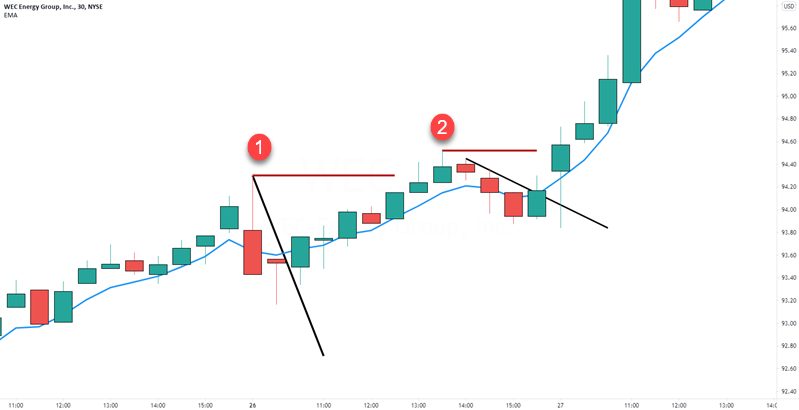
In this example, 1 and 2 are the swing high levels to be concerned with. There is no right or wrong answer as to what to do at these levels. It all comes down to each trader and their comfort level when they see price stalling and failing to advance..
One thing to consider is that since price action has come back to the high, the trade is a success. Going to break even while still allowing the trade to develop may not be a bad idea.
Stop Loss Locations
There are many methods to placing your stop but consider that pullbacks are moving in a diagonal direction. That is one reason I like the lower time frame range breakout entry.
You get a price structure area (below the support level of the range), to place your stop.
Consider using the average true range from the high of the entry candle and include a multiple of the ATR.
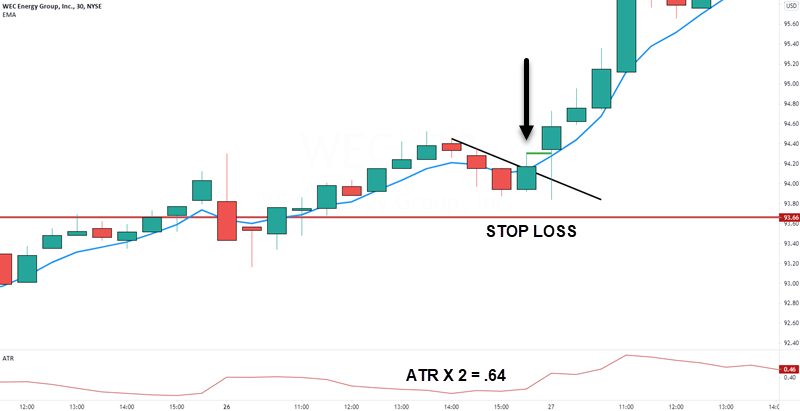
A buy stop at the high of the candle that broke and close above the average has the arrow.
We take the ATR reading at that candle, multiply by two, and subtract from the high of the candle.
That gives us the red line as our stop loss.
Conclusion
The reason the pullback is my favorite pattern is because it is derived from the natural movement of price.
The tricky party is the trade entry which is why you should experiment with different entry triggers.
For me, I do like the lower time frame entry and my second approach is the break of the moving average.
All of this article applies to short positions as well.