- May 15, 2023
- Posted by: Shane Daly
- Categories: Trading Article, Trading Indicators
The best stochastic settings for a 15-minute stock chart is generally a 14-period %K (fast stochastic line) and a 3-period %D (slow stochastic line) with settings of 14,3,3. These settings offer a good balance between sensitivity and reliability, helping traders identify overbought and oversold conditions, as well as potential trend reversals.
The ideal settings will vary depending on your trading strategies and preferences, so it’s important to test and adjust them based on your needs.
Stochastic oscillator is a popular technical indicator used by traders to identify overbought and oversold conditions in the market. It is a momentum oscillator that compares the closing price of a security to its price range over a specific period of time.
There are two stochastic lines – %K and %D – that fluctuate between 0 and 100. The %K line is the more sensitive of the two lines, while the %D line is a moving average of %K.
Stochastic oscillator is a versatile indicator that can be used in different timeframes and trading strategies including swing trading and day trading.
To get the most out of this indicator and any trade signals it gives, you should understand the importance of the settings and how to optimize them for different timeframes and strategies.
Why Use The 15 Minute Chart For Stocks
The 15 minute chart is a popular time frame for day traders and short-term traders. It is a timeframe that provides a balance between the speed of price action (and potential setups) and the quality of the trade signal.
 In this timeframe, traders can identify short-term trends and opportunities that may not be visible in longer timeframes. However, trading on the 15 minute chart does require a higher level of precision and speed, as the price movements can be fast and volatile.
Stochastic Oscillator Settings
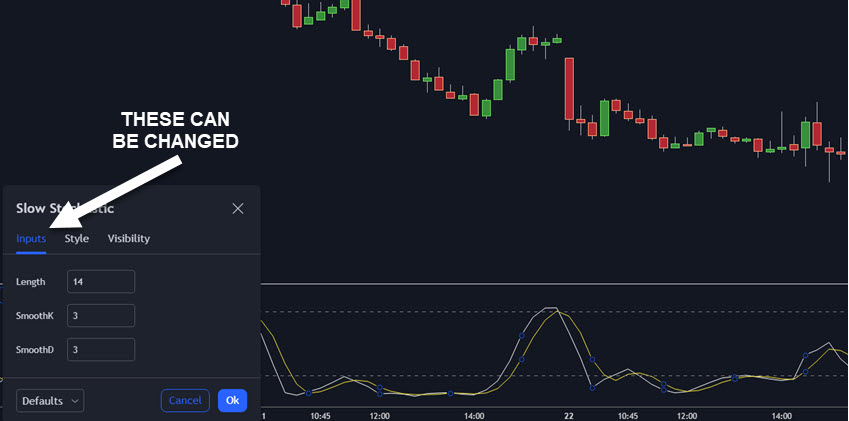
The stochastic settings refer to the parameters used to calculate the oscillator, such as the number of periods, the smoothing factor, and the levels you will use to indicate overbought and oversold conditions.
These settings can have a impact on the performance of the oscillator and the signals it generates.
Using the wrong settings can result in false signals, missed trading opportunities, and larger losses.
Basic Settings
Basic stochastic settings are often set to 14 periods and 3 smoothing. These settings are commonly used by traders as a starting point to identify overbought and oversold conditions in the instrument being traded.
 The basic settings work by comparing the closing price of a security to its price range over the last 14 periods.
| %K line | Description |
|---|---|
| Definition | Primary line of the stochastic oscillator, reflecting the current closing price relative to the high and low prices of a specified period. |
| Formula | %K = [(Current Close – Lowest Low) / (Highest High – Lowest Low)] * 100 |
| Range | Percentage value ranging between 0 and 100, indicating the relative position of the current close within the recent price range. |
| %D line | Description |
|---|---|
| Definition | Moving average of the %K line, acting as a signal line. |
| Calculation | Typically a 3-period simple moving average of the %K values. |
| Benefits | Smoothes %K line’s fluctuations, helping traders identify trend reversals more effectively and reducing the likelihood of false signals. |
Oversold and Overbought Levels
The default levels used to indicate overbought and oversold conditions are 80 and 20. When the %K line crosses above 80, it is considered overbought and a potential sell signal. When the %K line crosses below 20, it is considered oversold and a potential buy signal.
The use of basic stochastic settings depends on the market conditions and the trading strategy you use.
 Basic stochastic settings can be effective in trending markets, where they can identify overbought and oversold conditions and potential reversal points. They can also be useful in range-bound markets, where they can identify potential entry and exit points. In volatile or choppy markets, basic settings may generate false signals and lead to losses.
Basic Settings: Advantages and Disadvantages
The advantages of using default stochastic settings are their simplicity and ease of use. Traders often look for the best stochastic oscillator settings only to find those settings only fit the current market condition. Curve fitting during optimization leaves traders with a trading strategy that is useless when market conditions change.
The disadvantages of using default stochastic settings are their limited accuracy and potential for false signals. They can also be affected by market noise and false breakouts, which can result in losses.
To use basic stochastic settings effectively, you need to understand their strengths and weaknesses, and use them in the appropriate market conditions and trading strategies being used.
When searching for settings, consider small tweaks and test in a variety of markets.
Finding the Best Stochastic Settings for 15 Minute Chart
To find the best settings for the 15 minute chart, it is important to test and experiment with different settings to find the ones that work best for your trading style and time frame.
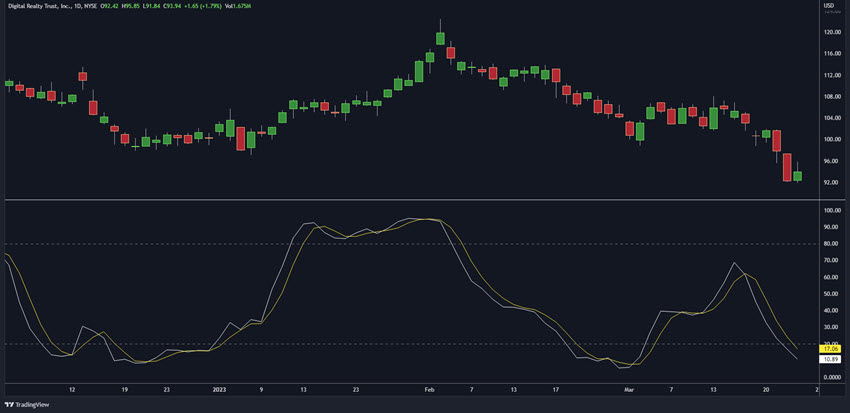
The default settings may not always be suitable for the 15 minute chart, as it is a faster and more volatile timeframe compared to longer ones such as a daily chart.
Test and Experiment
It’s important to test and experiment with different settings as it enables you to identify the settings that are best suited for your trading style and time frame. This process helps you achieve better trading results by tailoring the stochastic oscillator to your specific needs.
By testing and experimenting with different settings, you can identify the settings that work best for your trading goals and objectives.
When searching for the ideal settings for the 15 minute price chart, keep the following tips in mind:
Start with the default settings:
To get a feel for the indicator and how it performs on this time frame. It’s an excellent starting point to build your understanding and confidence with the stochastic oscillator.
Test different periods and smoothing factors:
Try different periods and smoothing factors to see how they affect the indicator’s performance. For example, you could try using a shorter period (such as 10) or a longer period (such as 20) to see how it affects the signals.
Adjust the overbought and oversold levels:
The default levels may not always be suitable for the 15 minute chart. Try adjusting the levels to see how it affects the signals.
Combine with other indicators:
Stochastic oscillator can be combined with other indicators on the 15 minute chart, such as moving averages or RSI.
Back test and analyze the results:
Once you’ve tested and experimented with different settings for the stochastic indicator, test the results and analyze the performance. This can help you identify the optimal settings for your trading style and timeframe.
Here are some examples of different settings and their results on the 15 minute chart:
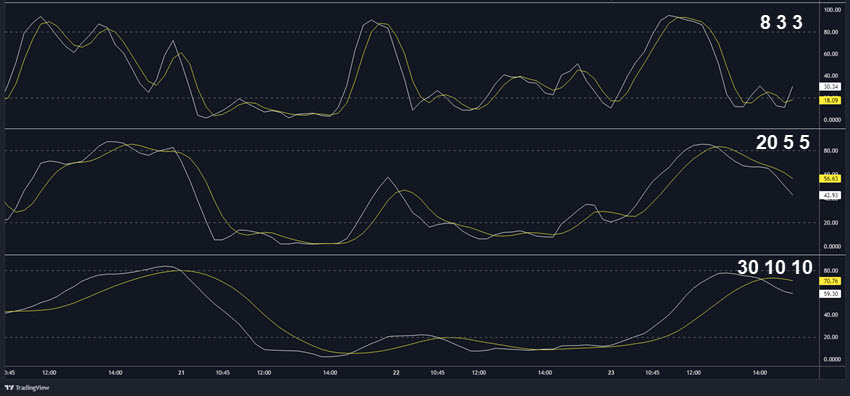
| Period | Smoothing Factor | Signal Frequency | Signal Reliability | Signal Responsiveness |
|---|---|---|---|---|
| 8 | 3 | More frequent | Prone to false signals in volatile markets | – |
| 20 | 5 | Moderate | More reliable | Slower to respond to price movements |
| 30 | 10 | Less frequent | Smoother signals | Less sensitive to short-term trends |
Finding the best stochastics oscillator settings for the 15 minute chart requires testing and experimenting with different settings to find the ones that work best for you.
15 Minute Chart Stochastic Strategy
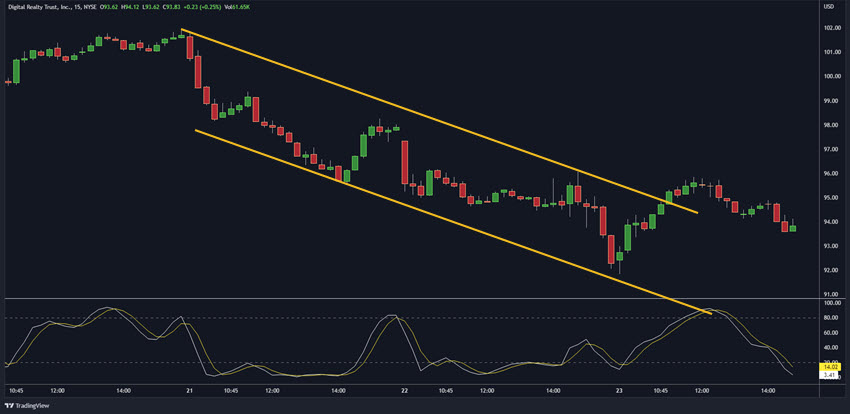
In our example, we will be using my favorite slow stochastic oscillator setting of 8, 3, 3 on a 15 minute stock chart. I will also be using a 20 period simple moving average and standard trend line channels.
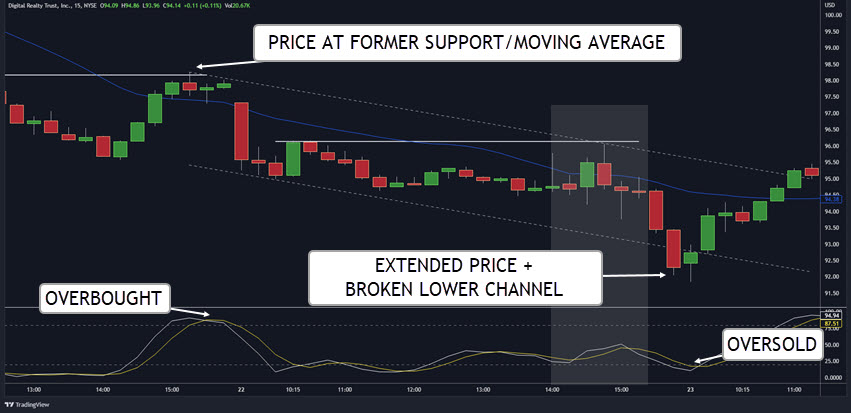
Price is in a bearish trend as shown by price action and the slope of the moving average. The first trade has stochastics overbought, price has pulled into the moving average and former support zone. Trade can be taken at a hook of the indicator on candle close.
In the middle, price has pulled back into resistance and fell. The issue is the indicator is almost at the middle of the extreme values. Market price confirms the indicator as it is in a range pattern and not at a market turning points.
We then get price being oversold on momentum candlesticks. Price is extended from the moving average which points to potential mean reversion. We see the support line of the channel is broken but a reversal candle bring price back up over the bottom channel. Combined with a hook of the stochastics, this is a great setup for a counter trend trade and potential bullish trend forming.
Best Practices for Using Stochastic Oscillator
To maximize its effectiveness, considering using it in combination with other technical analysis tools and avoid common trader mistakes that can lead to losses. Remember that overbought or oversold levels does not mean we will see a reversal in price.
In this step, we’ll explore the best practices for using the stochastic oscillator and provide tips and examples to help you improve your trading performance.
Other Technical Indicators
Stochastic oscillator is just one of many technical analysis tools available to traders. Considering using it in combination with other tools, such as moving averages, price patterns, trend lines, and support and resistance levels.
Your trading platform has many options to try including the slow stochastic indicator which uses a different formula than the fast version.
Common Mistakes
One common mistake when using the stochastics indicator is relying solely on the default settings without testing and experimenting with different settings.
Another mistake is using stochastic oscillator as a standalone indicator, without considering other technical factors that may affect the market.
Traders should avoid using stochastic oscillator in choppy or volatile markets, as it is not as reliable especially when used in isolation.
Maximize Effectiveness
- To maximize the effectiveness of stochastic oscillator, consider the following tips:
- Use it in combination with other technical analysis tools such as the MACD indicator
- Test and experiment with different settings to find the ones that work best.
- Avoid using it in choppy or volatile markets. Focus on a trending market.
- Use it in conjunction with other confirmation indicators, such as volume or moving averages.
- Consider the broader market trends and patterns when analyzing signals generated by stochastic oscillator including stochastic divergences.
- By following these best practices and tips, you can maximize the effectiveness of stochastic oscillator and improve your trading results.
Conclusions
We’ve covered the importance of using stochastic oscillator to identify overbought and oversold conditions in the market. We’ve explored the advantages of using the 15 minute chart, the basic settings, and how to find the best stochastic settings for this timeframe.
We’ve discussed the best practices for using stochastic oscillator in combination with other technical analysis tools and avoiding common mistakes that can lead to losses. By following these guidelines, you can optimize your stochastic signals and improve your trading performance on the 15 minute chart.
Remember, trading is a continuous learning process, so don’t be afraid to test and experiment with different settings and strategies to find what works best for you. With the right tools and mindset, you can achieve your trading goals and succeed in the markets.
Common Questions
Q: What is the stochastic oscillator and what is it used for?
A: The stochastic oscillator is a popular momentum indicator used by traders to identify overbought and oversold conditions in the market. It compares the closing price of a security to its price range over a specific period of time and consists of two lines – %K and %D – that fluctuate between 0 and 100.
Q: Why use the 15 minute chart?
A: The 15 minute chart is a popular timeframe for day traders and short-term traders as part of a trading strategy because it provides a balance between the speed of execution and the quality of the signals. In this timeframe, traders can identify short-term trends and opportunities that may not be visible in longer timeframes.
Q: What are the basic settings and how are they used?
A: The basic stochastic indicator settings refer to the standard parameters used to calculate the stochastic oscillator, which are often set to 14 periods and 3 smoothing. These settings are commonly used by traders as a starting point to identify overbought and oversold conditions in the market.
Q: How do I find the best stochastic settings for the 15 minute chart trading strategy?
A: To find the best settings for the 15 minute chart, it is important to test and experiment with different settings to find the ones that work best for your trading style and timeframe. Some tips include starting with the default settings, testing different periods and smoothing factors, adjusting the overbought and oversold levels. Also consider using the fast stochastic oscillator.
Q: What is the best ways to use the stochastic indicator?
A: The best ways for using stochastic oscillator include using it in combination with other technical analysis tools, avoiding common mistakes such as relying only on standard settings, and maximizing its effectiveness by using it in conjunction with other confirmation indicators.
Tired Of Trading With Overused Indicators?
Try something different and get the
“Ultimate Guide to Price Pattern Trading” – ABSOLUTELY FREE!
Learn how to trade with precision accuracy, find ideal entry points,
and create a lifetime of trading income using patterns and price action.
Download your FREE guide now and start mastering the art of successful trading!