- April 1, 2024
- Posted by: Shane Daly
- Categories: Trading Article, Trading Indicators

Combining the Stochastic Oscillator with Moving Averages creates a robust trading strategy. This combination improves the analysis of market trends by providing a comprehensive view of market movements. Using these technical indicators together, you can pinpoint potential reversal points, and overbought or oversold conditions, which can help you make better trading decisions.
Understanding how these indicators complement each other can help enhance your trading strategy and increase profits. This synergy can give you a competitive advantage in the market and significantly enhance your overall trading performance.
Understanding Stochastic Oscillator
To understand the Stochastic Oscillator, you need to know how it’s calculated and what it means in a technical analysis approach to trading. This indicator looks at the relationship between a closing price and the price range over a set period. It helps spot potential changes in trends by comparing the current price to its range.
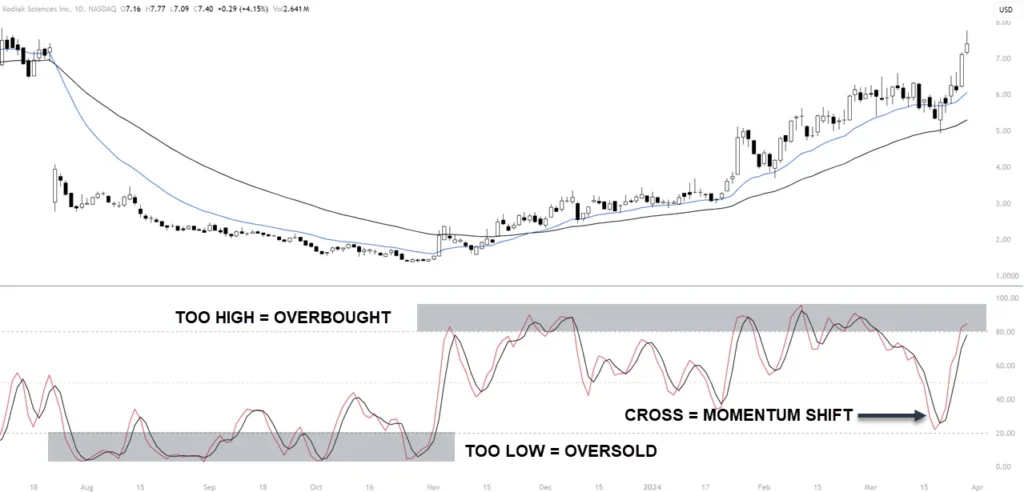
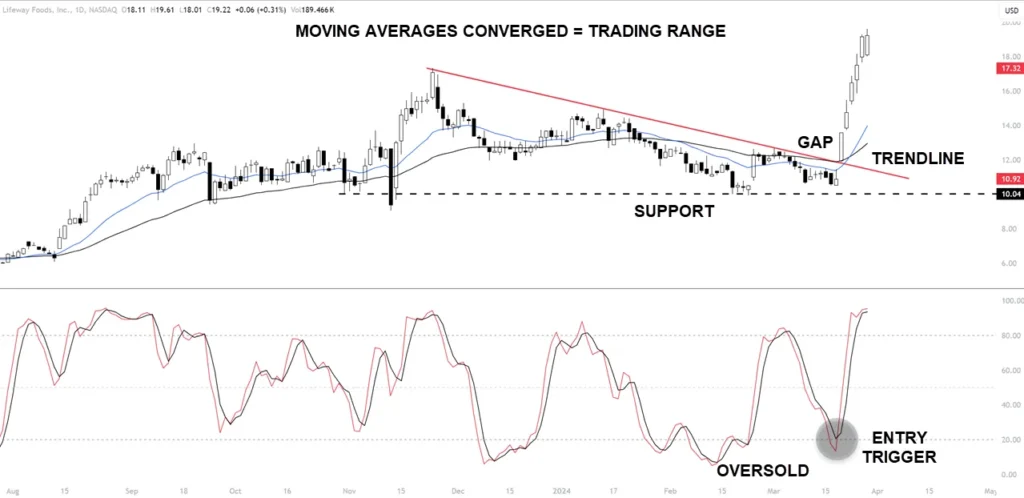
When the oscillator goes above 80, it suggests the asset might be too high, hinting at a possible upcoming downtrend. On the flip side, if it drops below 20, it could mean the asset is undervalued, signaling a potential uptrend. Recognizing these key levels is the best way to interpret the Stochastic Oscillator effectively.
Also, consider the crossing of the lines as a momentum shift. Inside of a trading plan with setups, this could also be a trade entry technique.
Exploring Moving Averages
When you look at moving averages, you can see how this tool smooths price data to show underlying trends more clearly. Here are three important points to consider:
- Exponential Smoothing: Moving averages use exponential (EMA) smoothing to give more importance to recent price data. This makes them more responsive to current market conditions compared to simple moving averages. It helps you stay updated on the latest trends and potential market changes.
- Trend Identification: Moving averages are useful for spotting trends in the market. By analyzing short-term and long-term moving averages, you can identify trends like uptrends, downtrends, or sideways movements. This information can help you make trading decisions based on the trend direction.
- Price Data Visualization: Moving averages visually represent price movements over a specific period, making it easier to understand market trends and patterns. This visualization can help you grasp the overall price direction and identify potential support or resistance levels.
Benefits of Combining Both Indicators
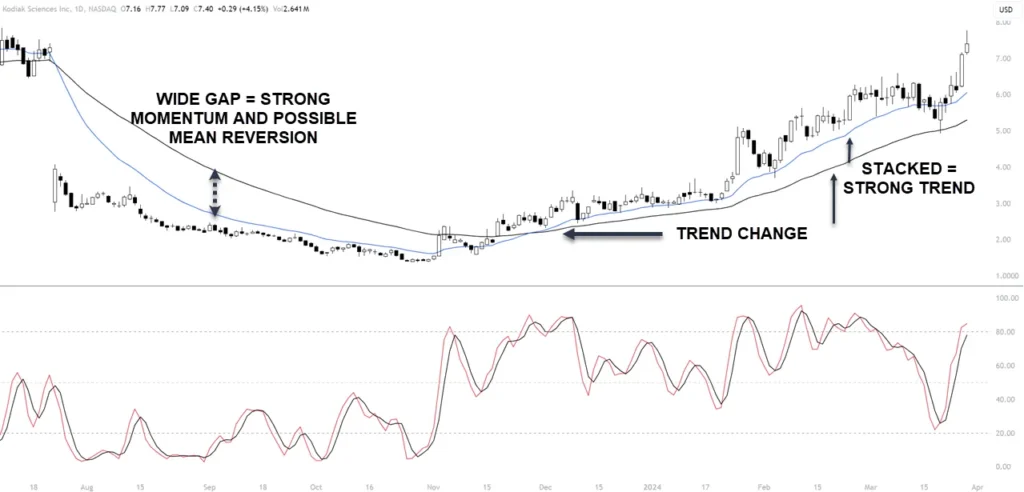
Combining the stochastic oscillator and moving averages helps you analyze market trends more effectively. By using these two tools together, you get a more comprehensive view of market movements. Moving averages show a smoothed-out trend direction over a specific period, giving you insights into overall market sentiment.
 On the other hand, the stochastic oscillator helps identify potential reversal points within a trend, indicating when the market is overbought or oversold. When the oscillator makes a big move to the upside, this is a good time to watch for a pullback and then a reversal back in the direction of the moving averages.
The advantage of combining the stochastic oscillator with moving averages is that they complement each other. While moving averages provide a broad perspective on market trends, the stochastic oscillator gives timely signals for potential trend reversals. This combination helps you confirm trends identified by moving averages and pinpoint entry or exit points based on stochastic signals.
Fine-Tuning Entry and Exit
When adjusting your entry and exit points in trading, consider timing strategies that match your risk tolerance. Identifying exit signals can help you make better decisions on when to bank your profit.
Entry Timing Strategies
To improve the accuracy of your trading entries, consider refining your entry and exit strategies by combining the Stochastic Oscillator with Moving Averages and other technical analysis tools.
When deciding when to enter a trade, keep the following points in mind:
- Look for Candlestick Patterns: Keep an eye out for patterns such as dojis or engulfing candles to help you identify potential entry points.
- Analyze the Trend: Use moving averages to determine the main trend and only take trades that are in line with the overall market direction.
- Confirm with Stochastic Indicator: Wait for confirmation from the Stochastic Oscillator before entering a trade, making sure it aligns with the trend and other technical indicators.
Exit Signal Confirmation
To improve your exit signals, consider using the Stochastic Oscillator and Moving Averages. These tools can help you make more precise trading decisions by refining your entry and exit strategies.
Watch for the Stochastic Oscillator crossing below 20 in an oversold condition or above 80 in an overbought situation as potential indications of a trend reversal. Additionally, incorporating Moving Averages can strengthen your exit signals.
For instance, if the price crosses below a short-term Moving Average like the 20-day MA, it might signal a bearish trend reversal, prompting you to consider exiting a long position. By combining these indicators, you can better confirm exit signals and improve your trading results.
Setting Up the Strategy
By combining the stochastic oscillator and moving averages in your analysis, you can now set up a strategy to evaluate market trends effectively using the following steps:
| Step | Description |
|---|---|
| Define Clear Entry Criteria | Establish specific parameters based on the stochastic oscillator and moving averages crossover to determine the ideal trade entry points. Look for the stochastic oscillator to cross above a certain level while the moving averages align in a particular manner. |
| Plan Your Exit Strategy | Develop a clear plan for when to exit a trade to secure profits or limit losses. Use signals from the stochastic oscillator and moving averages to pinpoint potential exit points. Set profit targets based on past price movements or utilize trailing stop-loss orders for protection. |
| Implement Risk Management Techniques | Integrate risk management practices like position sizing, stop-loss orders, and diversification to reduce potential losses and optimize returns. By combining these elements, you can create a strong trading strategy that capitalizes on the strengths of both indicators for well-informed decision-making. |
Risk Management Techniques
To improve how you manage risks and make better decisions on when to enter and exit trades, consider combining the Stochastic Oscillator with Moving Averages. Here are some key points to keep in mind as you refine your trading strategy:
- Position sizing: Calculate the right amount of money to invest in each trade based on your risk tolerance and overall investment plan.
- Stop loss: Set up stop-loss orders to limit potential losses and safeguard your investment if the trade goes in the wrong direction.
- Entry and exit points: Use the signals from the Stochastic Oscillator and Moving Averages to identify the best times to enter and exit trades, increasing the chances of profitable outcomes while reducing risks.
Trading Strategies Using Both
Using both the Stochastic Oscillator and Moving Averages in trading strategies can help analyze trends and determine entry and exit points effectively. Here’s how to combine these tools:
- Identifying Trends: Moving Averages can help identify trends in the market, while the Stochastic Oscillator can confirm whether the market is overbought or oversold.
- Entry and Exit Signals: When Moving Averages cross, it can signal potential entry or exit points. The Stochastic Oscillator can provide additional confirmation for these signals.
- Spotting Price Reversals: Semantic Entities Watch for convergence or divergence between Moving Averages and the Stochastic Oscillator to pinpoint possible price reversals.
Sample Conservative Strategy Outline
 Setup Indicators:
- Moving Averages (EMA): Use two moving averages of different timeframes (e.g., a short-term 50-day MA and a long-term 200-day MA).
- Stochastic Oscillator: Set up with standard settings (usually 14 periods).
- Identifying Trends:
- Uptrend Confirmation: When the short-term MA is above the long-term MA, it suggests an uptrend. Confirm this with the Stochastic Oscillator not being in the overbought area (above 80).
- Downtrend Confirmation: When the short-term MA is below the long-term MA, it suggests a downtrend. Ensure the Stochastic Oscillator isn’t in the oversold area (below 20).
- Entry Signals:
- Buying Signal: Consider buying when the short-term MA crosses above the long-term MA (bullish crossover), and the Stochastic Oscillator moves above 20 but below 80.
- Selling Signal: Consider selling or shorting when the short-term MA crosses below the long-term MA (bearish crossover), and the Stochastic Oscillator moves below 80 but above 20.
- Exit Signals Considerations:
- Selling for Profit: Exit a buy position when the Stochastic Oscillator approaches or exceeds 80, indicating overbought conditions.
- Covering a Short: Exit a short position when the Stochastic Oscillator approaches or falls below 20, indicating oversold conditions.
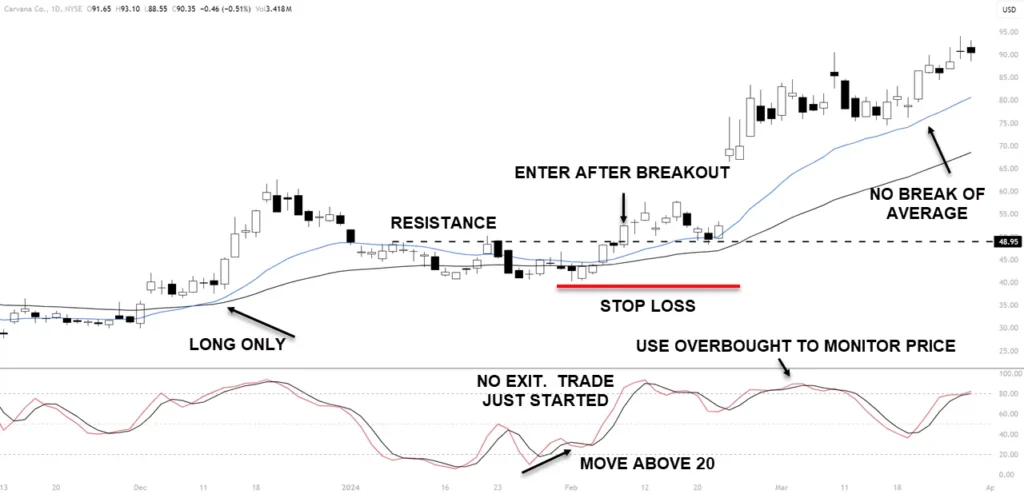
- Combine: Look for overbought for longs and then monitor the price for any break of a faster moving average.
- Spotting Price Reversals:
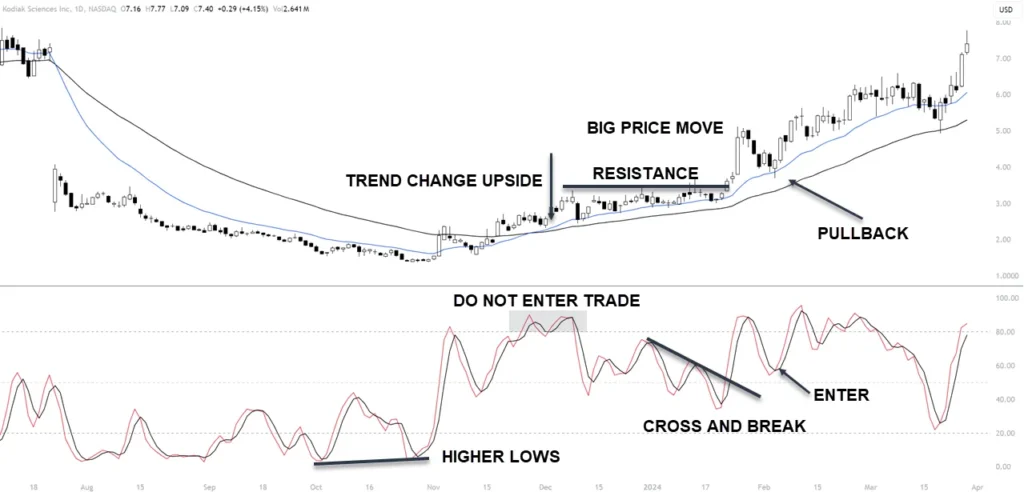
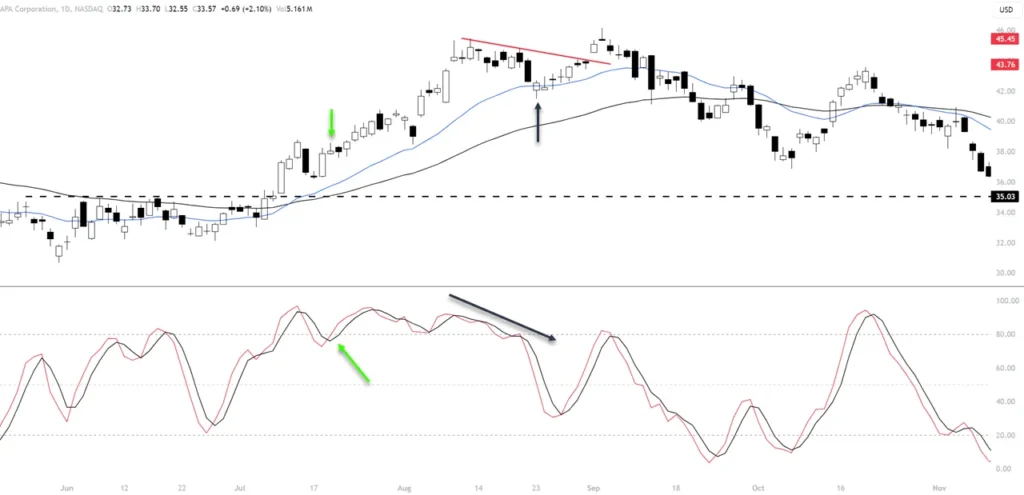
- Bullish Reversal: Watch for divergence when the price is making new lows, but the Stochastic Oscillator forms higher lows.
- Bearish Reversal: Look for divergence when the price is making new highs, but the Stochastic Oscillator forms lower highs.
- Risk Management:
- Set stop-loss orders based on a percentage of your trade size or using technical levels such as recent highs or lows.
- Determine position size based on your risk tolerance and the volatility of the stock.
This is a basic framework for you to start with. Learning to read price action and understanding breakouts such as the example, will go a long way in building a robust strategy. The move above 20 is a signal for a long however price was in a trading range and needed to break out before entry.
Additional Considerations
- Time Frame: Adjust the time frame of your charts based on your trading style (e.g., daily for swing traders, and hourly for day traders).
- Backtesting: Before implementing, backtest this strategy using historical data to understand its effectiveness.
- Market Conditions: Be aware that different market conditions might require adjustments to the strategy.
- Supplement with Other Analysis: Consider using additional technical indicators/price action or fundamental analysis to complement this strategy.
Conclusion
In simple terms, when you combine the Stochastic Oscillator with moving averages, you get a powerful tool that helps traders analyze market trends and make informed decisions. Understanding how these indicators work together allows traders to pinpoint when to enter or exit trades, improve timing, and boost trade accuracy.
This strategy provides a practical way to navigate the market’s complexities and maximize profits. With careful analysis and adjustments, traders can enhance their trading performance and reach their financial objectives.