- January 15, 2024
- Posted by: Shane Daly
- Categories: Trading Article, Trading Tutorials
Through this guide, we’ll look into day trading patterns like Head and Shoulders, Flags and Pennants, Double Tops and Bottoms, Triangles, and the Cup and Handle. Our focus will be on finding a way to get these patterns into your trading strategy, understanding the psychology that drives them, and offering practical, actionable tips for each pattern.
 Key Takeaways
- Head and Shoulders pattern: A signal of potential trend reversal.
- Flags and Pennants: Indicate a likely continuation of the current trend.
- Double Tops and Bottoms: Suggest a possible market reversal.
- Triangles: Hint at a tight market that may lead to significant price shifts and explosive moves.
- Cup and Handle pattern: Often a beginning to uptrends, signaling a buying opportunity.
Chart Patterns Significance For Day Traders
Analyzing market charts is important because they help predict possible price changes and can often highlight trading opportunities. The psychology behind these patterns reveals the collective mood and decisions of traders. By recognizing these patterns in the chart, you begin to understand how the shifts in price can lead to an objective explanation of what is to come.
As your experience grows, you’ll notice certain patterns that hint at upcoming changes in the market, giving you insights into what traders might be thinking. Whether the market looks set to rise or fall, this information is useful to have for any trading plan. Timing your trades could be the difference between making a profit or suffering a loss (you wouldn’t trend trade in a ranging instrument).
Head and Shoulders Pattern
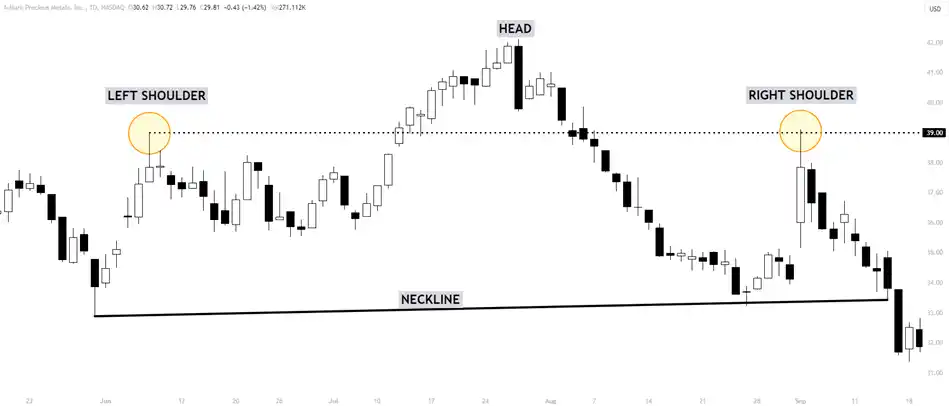 The head and shoulders pattern is often seen by day traders, and it’s a trusted sign that the market’s direction might change. The trust in this pattern comes from its specific details, which experienced traders can read. It has three peaks: the center one being the tallest, like a head, and the two sides are lower, forming the shoulders.
| Feature | Description |
| Pattern Appearance | Looks like a head with two shoulders on each side |
| Market Prediction | Indicates a shift from a rising to a falling market, or the other way around |
| Trustworthiness | Considered strong, especially when backed by trading volume and additional indicators |
| Trading Approach | Traders might buy or sell when the price crosses the “neckline” of the pattern |
By getting to know how this pattern works, traders can better anticipate when the market might change direction.
Flags and Pennants Insights
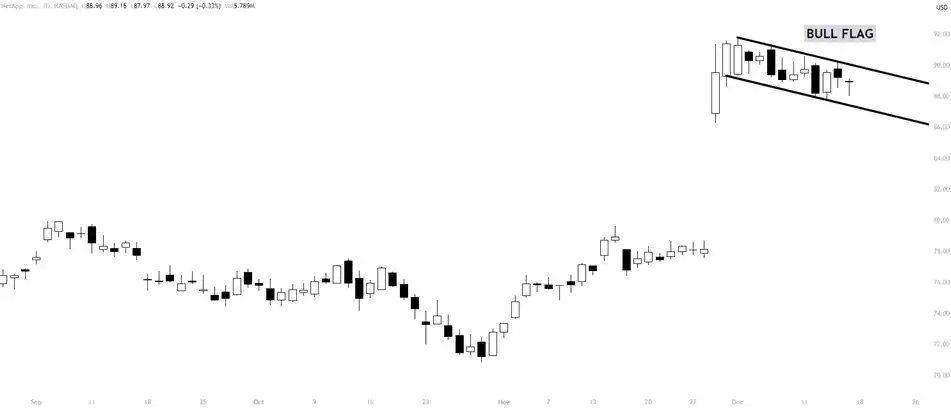 Moving past the head and shoulders pattern, it’s good to know about flags and pennants, which are useful in predicting short-term trends in day trading. These chart patterns are signals for potentially continuing an upward trend after a sharp increase (the first directional leg).
A flag pattern is made up of parallel lines that go against the ongoing trend direction, and a pennant is more compact, and shaped like a small, symmetrical triangle that points horizontally.
Flags and pennants are reliable because they happen often and their results are fairly predictable especially if the first leg in price has momentum. Traders often check the trading volume to confirm a breakout, anticipating a rise that could match the strength of the previous upward trend. That said, I don’t need a volume increase at the breakout but it must come in over the next several candlesticks for confirmation of the new price move.
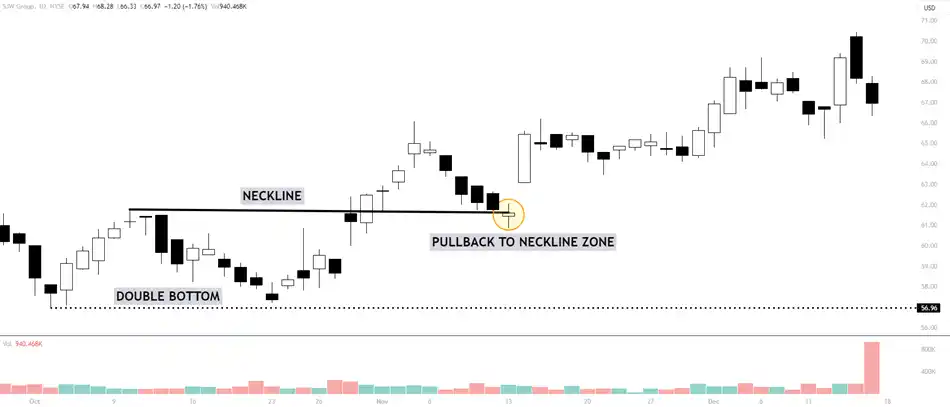
Double Tops and Bottoms
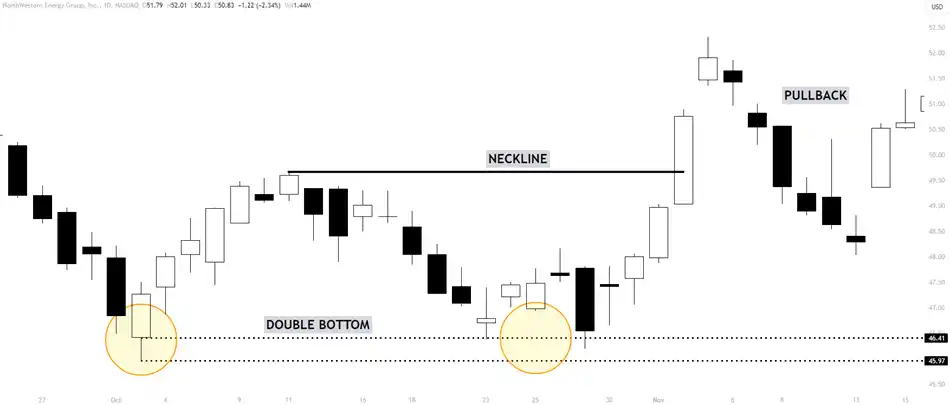 Spotting a double top or bottom on a chart is a clear indicator that the market might be about to change direction. To make the most of your trade, it’s vital to analyze the pattern’s strength and find the best moments to enter and exit the market.
Keep in mind, that trading without considering the trading volume is risky because volume is a key factor that confirms the pattern is trustworthy.
‘Trading isn’t just about the patterns you see; it’s about understanding the story behind the movement. Volume is the voice of the market.’
Reversal Signal Strength
Recognizing double tops and bottoms is important because they can signal a potential change in market direction that may provide you with a trading opportunity. These patterns are more than just shapes; their value as indicators depends on confirming the signals they provide.
When you’re analyzing these patterns, it’s not enough to identify their shape; you should also take into account trading volume, the duration of the pattern’s formation, and the movement of prices after the pattern is complete. You need the last peak or trough to break for confirmation of the new direction. A break and a pullback to the breakpoint along with a reversal is a strong confirmation
 With experience, you come to understand that signals vary in their reliability. A double-top pattern followed by a noticeable decrease in volume at the second peak, or a double-bottom pattern accompanied by a sharp increase in volume during the rebound, can be the difference between a failed pattern and a profitable trading opportunity.
Trading is both an art and a science. Recognizing patterns is just the beginning; understanding their implications and timing your moves with a degree of precision is what separates successful traders from the rest.
Entry and Exit Points
To succeed in trading, you need to get a handle on the best times to enter and exit trades, especially with double tops and bottoms. These patterns are a favorite for day traders because they’re often a good indicator of market movement. Spotting the pattern is step one – here’s what comes next:
- Spot the neckline: This is where the price seems to hit a ceiling in a double top or a floor in a double bottom.
- Wait for a clear breakout: You’re looking for the price to close beyond the neckline convincingly.
- Place stop-losses: To protect yourself from large losses, set stop-loss orders just below the second bottom in a double bottom, or just above the second top in a double top.
Emotional detachment and sticking to your trading plan are some of the variables you need for success – don’t let feelings get in the way of strategy. I often say that ” to make the most of your trades, a cool head and attention to detail are your best allies.
Volume Confirmation Importance
Understanding the volume is something to consider when you’re examining chart patterns like double tops and bottoms. With a double top, which suggests the price might start falling, you often see a lot of trading activity at the first peak and less on the second, showing that the interest in buying is dropping off.
On the flip side, a double bottom, which might mean prices are about to rise, should show more trading activity at the second low point, indicating that buyers are getting involved.
Paying attention to volume isn’t just a minor detail and is often a big part of a trader’s toolbook. The more you trade, the better you’ll get at noticing these hints of upcoming major price changes, and that can help you make trades with more assurance and accuracy.
Triangles in Market Consolidation
When you’re keeping an eye on stock markets during times when they’re not making big moves, it’s smart to watch for triangle patterns. These patterns on the chart can give you a heads-up on where things might be heading next.
 An ascending triangle shows up with a straight line on top and a climbing line on the bottom. This often means that prices could go up, so traders tend to get ready for stocks to rise.
On the flip side, a descending triangle has a straight line on the bottom with a sloping line on top, hinting that prices might drop, which suggests traders should prepare for stocks to potentially fall.
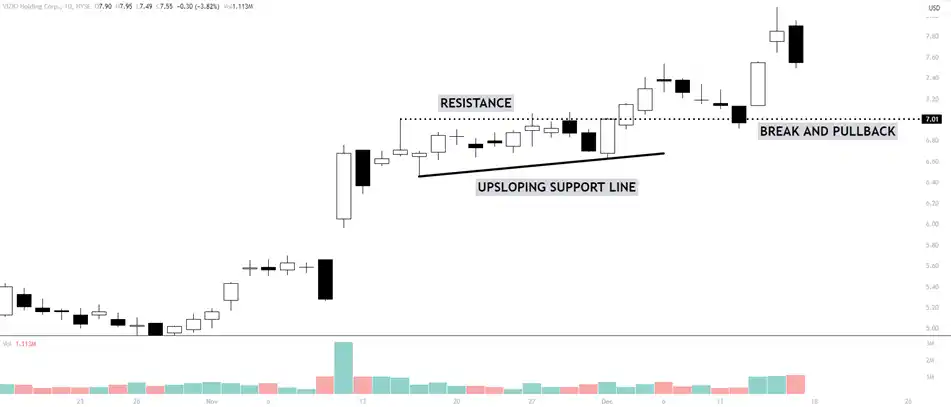
Ascending Triangle Breakouts
This pattern is characterized by a horizontal line that acts as a ceiling for prices and an upward-sloping line that forms the base, which suggests that buyers are growing more confident even as prices are not breaking higher.
Understanding the reliability of patterns and confirming breakouts are two important skills in reading ascending triangles:
- Pattern Reliability: It’s smart to check how often the prices have touched the support and resistance lines. The more touches there are, the more you can trust the pattern.
- Breakout Confirmation: To avoid jumping the gun on a breakout that isn’t real, wait for a sharp price rise accompanied by high trading volume (at break or soon after).
- Volume Analysis: A real breakout is typically supported by a significant uptick in trading activity, adding credibility to the pattern.
By paying close attention to these factors, you position yourself for making trades that have a better chance of working out in your favor.
Symmetrical Triangle Significance
Another critical pattern you’ll encounter as a day trader is the symmetrical triangle, which often emerges during periods of market consolidation. This pattern reflects a standoff between buyers and sellers, with neither gaining ground. Triangle psychology plays a pivotal role here; as the converging trendlines squeeze the price action, anticipation builds. Market participants are aware that a significant move is on the horizon, but the direction remains uncertain.
Pattern reliability enters the equation as you analyze the symmetrical triangle. While it suggests equilibrium, it’s the breakout that offers the tradeable opportunity, demanding your keen attention to volume and price action for clues. As you master the intricacies of these patterns, you’ll be better equipped to anticipate their resolutions.
One main rule I have is to never fade the break from a triangle – especially if the price is coiled far into the apex of the pattern.
Descending Triangle Predictions
When you notice a descending triangle on a chart, it often means the market could be gearing up for a shift. This pattern is seen as a bearish sign, showing that each time prices rise, they don’t go as high as before, while the lows hold steady.
Experienced traders pay close attention to these details:
- The lower highs of the descending triangle indicate that sellers are pushing harder than buyers.
- A strong move down through the support level is a clear sign that a downward trend might gain momentum.
- Ideally, trading volume should grow when the price breaks out, giving more reliability to this pattern’s prediction.
Smart traders know that while descending triangles can suggest a drop is coming, waiting for the actual market movement to confirm this is a smart play for beginning traders. As you gain experience, you may decide to implement certain candlesticks to use as triggers into an early entry.
Cup and Handle Forecasting
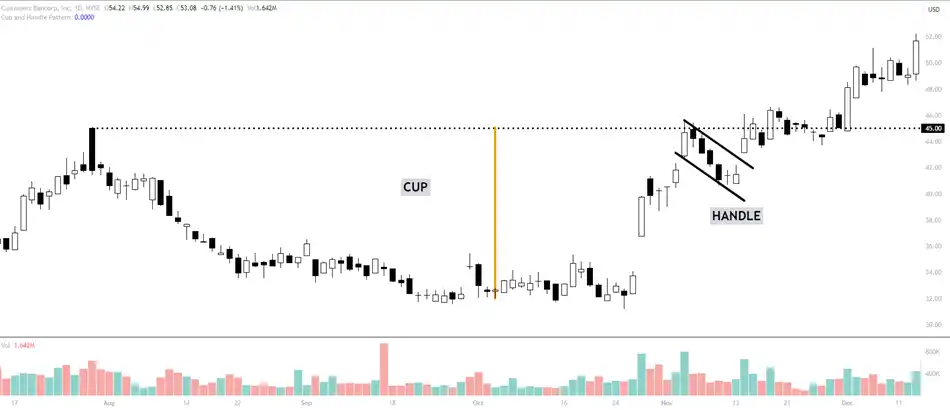 Understanding the cup and handle pattern can give traders insight into potential bullish trends in the market. This pattern is recognized by a period where prices drop and then rise to form what looks like a cup, followed by a smaller dip, creating the handle.
Experienced traders pay close attention to the depth of the cup and how long the handle lasts. A deep cup suggests that earlier selling pressure has eased, hinting at a possible strong rise in price if the pattern is complete. The handle should be just right in duration – not too short to question its validity, and not too long to imply a drop in buying interest. This is subjective but think of it as a bull flag formation in the way you will trade it.
When a deep cup is paired with a properly formed handle, it’s often a precursor to a significant price increase, especially if there’s a surge in trading volume to back it up.
Chart Patterns for Trading Strategies
If you’re getting into day trading, getting a handle on different chart patterns will be an asset as you face many variations of price action. These patterns show up because of how stock prices move on a chart, and they can give you clues about where the market might head next.
People who trade for a living tend to keep an eye on a few key things:
- Trend lines: These lines are super helpful because they show you which way the market is moving. They can help you see if the trend is likely to keep going or if it might flip the other way.
- Candlestick formations: These are like a window into how people are feeling about a stock. They can help you figure out the best times to buy or sell.
- Breakout patterns: When you see one of these, it means something big might be happening with the stock’s supply and demand.
When you put together all these pieces, you’re better prepared to guess what prices will do in the future. It’s about paying close attention and being disciplined with your trades. And here’s a personal tip: ‘Always remember that the best traders are those who learn to read the market’s language through its charts.’
Frequently Asked Questions
How Do External Factors Influence the Effectiveness of Chart Patterns for Day Trading?
Political events or economic updates often have a significant impact on financial markets, which can alter the reliability of chart patterns that day traders rely on. For example, unexpected election results or changes in employment rates can cause prices to move unpredictably, making it more challenging for traders to follow their usual strategies.
Can the use of Algorithmic Trading and Artificial Intelligence Systems Diminish the Relevance of Traditional Chart Patterns for Day Traders?
The rise of algorithmic trading paired with advanced artificial intelligence systems could significantly alter the way day traders rely on classic chart patterns. As AI becomes more involved in the markets, traders might find that certain patterns they used to rely on aren’t as reliable anymore. They may need to learn and apply more sophisticated trading methods.
To stay ahead, traders may benefit from integrating technology into their analysis. This doesn’t mean abandoning all traditional methods, but rather using technology as a tool to support and improve decision-making. Keeping up with technological trends is no longer optional for traders who want to remain competitive.
How Do Day Traders Deal With False Signals?
To deal with false signals and unpredictable chart patterns, day traders often use tight risk management rules and set stop losses. This approach helps them act quickly to minimize losses and protect their investments when the markets don’t move as they anticipated. Cut and run is never a bad rule when things aren’t going your way.
In What Ways Can a Day Trader’s Psychological Biases Impact the Interpretation and Application of Chart Patterns?
It’s important to remain objective and question your assumptions to ensure you’re making informed decisions based on the data, not just your expectations. As a day trader, it’s easy to let personal biases affect your interpretation of chart patterns. If you’re not careful, cognitive dissonance could cause you to miss warning signs, while confirmation bias might lead you to give too much weight to indicators that support your existing beliefs. This can result in skewed decision-making during live trades.
What Role Does Volume Analysis Play in Conjunction With Chart Patterns?
Understanding the significance of trade volume helps in confirming the reliability of chart patterns. It reflects the level of trader interest and conviction in a particular move. When day traders consider both volume and price movements, they can add confirming information to their trading decisions. While volume increase may not be strong at the breakout, you want to ensure there is an uptick in volume soon after the break. We need to see other traders joining in on the move so it can be sustainable.
Conclusion
Understanding and applying chart patterns in day trading is not just a skill but a necessity for success in the financial markets. As we’ve looked at in this article, each pattern – from the Head and Shoulders to the Cup and Handle – offers insights into the market and trader psychology. By adding these patterns to your trading strategies, you arm yourself with a better ability to anticipate market movements, make better decisions, and manage risks effectively.