- August 15, 2025
- Posted by: Shane Daly
- Category: Trading Article
You’ve seen those unique candlestick patterns that look like crosses on your trading charts. These are doji candles, and they’re powerful indicators of potential market reversals. When you understand how to spot and interpret these patterns, you’ll gain valuable insight into trader psychology and market momentum. Let’s explore how these simple yet effective formations can transform your trading approach.
TLDR
- Doji patterns reveal market indecision when opening and closing prices are identical, with shadows indicating potential trend reversals.
- Different doji formations (Standard, Gravestone, Dragonfly) provide unique insights into market sentiment and trader psychology.
- Successful doji trading requires confirmation from subsequent candlesticks before entering positions to avoid false signals.
- Combining doji patterns with support/resistance levels and broader market context increases trading strategy effectiveness.
- Higher time frame doji patterns typically carry more significance and reliability than those on shorter time frames.

What A Doji Candle Pattern Tells You
A doji candlestick tells a unique story of market indecision, appearing when buyers and sellers reach a standoff during a trading period.
When you’re looking at doji characteristics, you’ll notice the opening and closing prices are nearly identical, creating a small body with shadows extending above and below.
These shadows reveal trader sentiment and can help you spot potential trend changes.
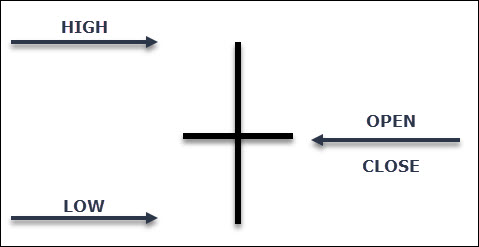
This is an idealized example as the open and close price were tight.
- We have an opening price and let’s assume price raced to the upside as shown by the upper shadow
- Buyers are in control (or shorts unloading positions). For part of this period, this candlestick would have been green (white)
- Price would hit a resistance level and either sellers step in or buyers unload their longs
- We then see price put in a low for the period and find some type of price support in that zone as evident by the long lower shadow
The cycle repeats where buyers step in and bring price back to where we started and we get our closing price.
It is clear that no side won the period. This is why it is often called a “neutral doji”
In this example, the candle closes with the bears slightly in control. Note the long lower shadow and then the close being greater than the 50% level of the candle. It closed red but the bulls were fairly strong.
This candle is still considered a doji. Price is still showing indecision with no side having an obvious victory at the close.
Time Frame Matters
Time frames play a huge role in maximizing your success with doji patterns. When you’re analyzing doji timeframes, remember that what you see on a 5-minute chart mightn’t carry the same weight as a daily chart.
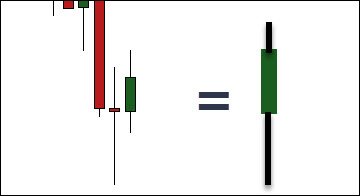
On one time frame, you would see the doji and the green candlestick the comes after it.
Changing to one time frame higher, you could see the candlestick on the right. Always consider the broader market context when interpreting doji signals. If you spot a doji on a shorter time frame, check higher time frames to confirm the overall trend.
That candle has a much different meaning; bulls were strong enough to drive price from the low of the period and close strongly positive on the day.
Use Other Technical Factors
Location matters when looking at the standard doji candlestick. Where you find one can give you a clue as to what to expect going forward.
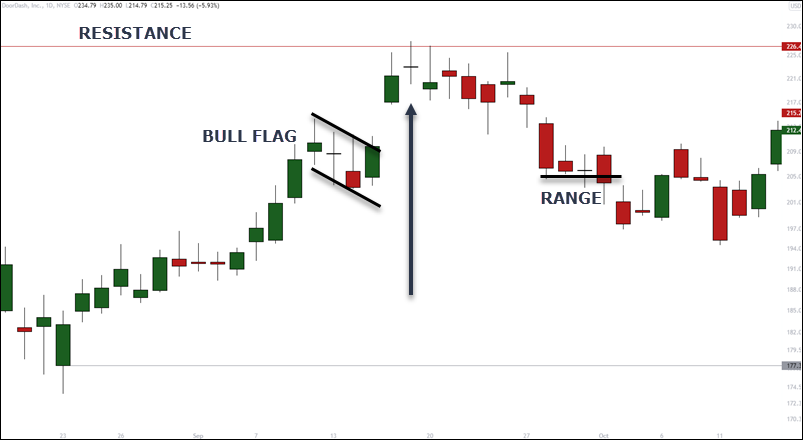
This is the daily stock chart of DASH. Price was in an uptrend and ran right into another test of a resistance level after a gap up.
Remember, the doji shows indecision on the part of market participants. The meaning becomes clear as a we get a reversal and price breaks down.
At the bull flag, the indecision candle was part of a continuation.
This is Home Depot.
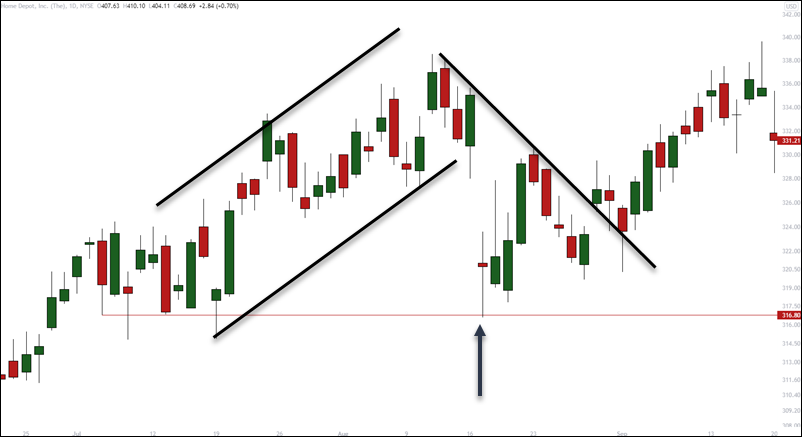
Price was climbing to all time highs before this pullback.
We see an obvious support level and the formation of a doji candle.
It acts as a reversal as HD heads off into new highs.
How Would You Trade A Doji Candlestick?
Creating a profitable doji trading strategy requires more than just spotting these distinctive candlestick patterns.
You’ll need to combine doji trends with other market signals and indicators to confirm potential reversals or continuations. Start by identifying key support and resistance levels where doji patterns carry more weight.
When you spot a doji, don’t rush into trades. Wait for confirmation from the next candlestick’s direction. Place your stop-loss orders just beyond the doji’s shadows, and always consider the broader market context.
We could also look for a reversal back in the direction of the current trend after some type of consolidation – including bull flags and bear flags.
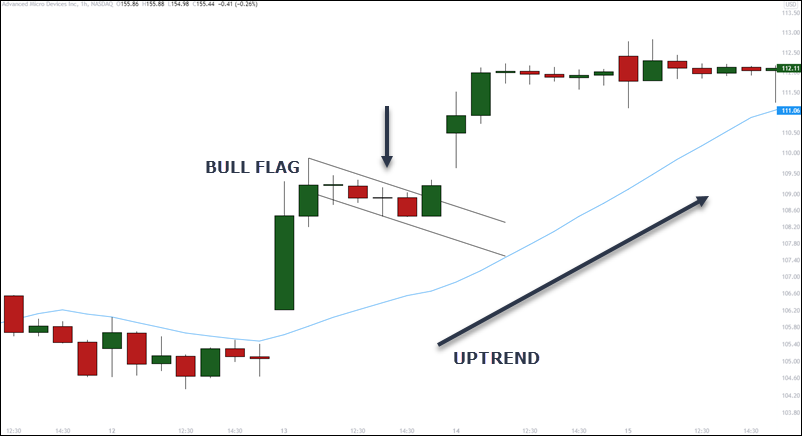
This is the one hour chart of AMD. Price is in an uptrend as defined by the 20 period moving average.
A bull flag starts to form as participants are not weighted on one side. One more candle down and price reverses.
Traders can use a break of the high of the doji as a price reversal trigger back into the uptrend.
How Do I Use It?
I use these types of candlestick for trade triggers the same as I do with the break of an inside bar.
When these candles break, we are seeing short term momentum in that direction. I prefer focusing on the overall trend and do not trade these without some other technical analysis of the chart.
Types Of Doji Candlesticks
The doji comes in a few different shapes and each has its own name:
- Gravestone doji
- Dragonfly doji
There are a few other variations but these two including the main one we talked about, encompass all you need to know. It is the concept of each that you must understand.
Gravestone Doji
The name is fitting as it shows the bulls, are literally dead as the period closes. I actually refer to this as a shooting star since it is handled pretty much the same. The GD is found in an uptrend (or in a corrective rally) and tells a fairly extreme story.
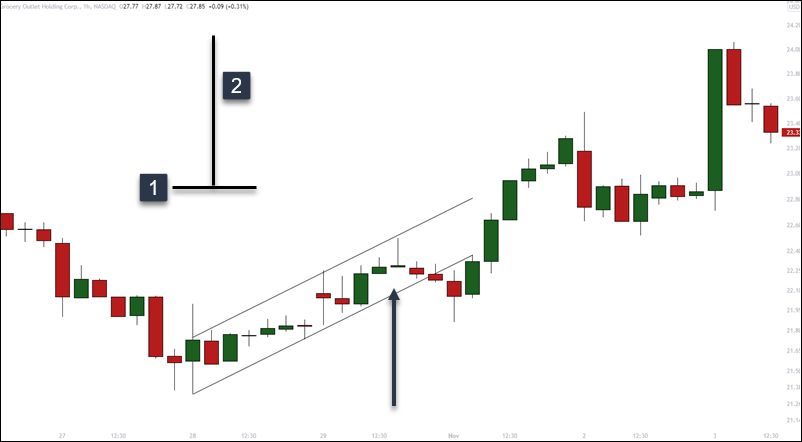
One hour time frame of GO. Market is coming off of lows and we have an obvious trend channel.
The gravestone doji shows up at the resistance line of the channel and we get a brief pullback.
How do we know it is the gravestone?
- Little no no body – open and close are virtually identical
- Long upper wick
This example, we get two types of doji candles.
A. Our neutral doji
B. Gravestone doji
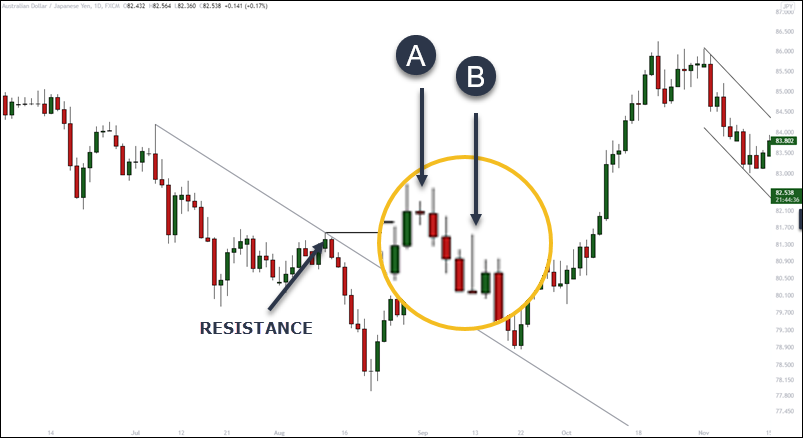
I chose this example because price was coming off a downtrend and it is not a textbook setup. Price rallied taking out a trend line and swing pivot. This is how an uptrend would start.
We get an inside doji and the gravestone shows where buyers attempted to continue the advance upwards.
By the end of the period, buyers were no where to be found and a bearish reversal is complete.
Key Point
You may not find the gravestone in the perfect location. In the last example, the gravestone actually showed up after the initial reversal.
Once the low broke of the gravestone doji, it confirmed the reversal. It was a confirmation candle. A short position dropped 188 pips once price broke the GD downside.
Dragonfly Doji
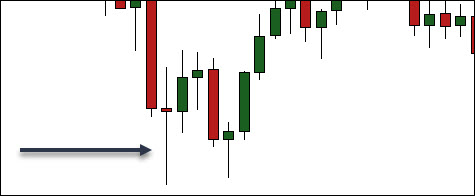
This is the exact opposite of the gravestone as a bullish candle. Price is in a downtrend or in a correction and the Dragonfly doji shows up with a long lower shadow.
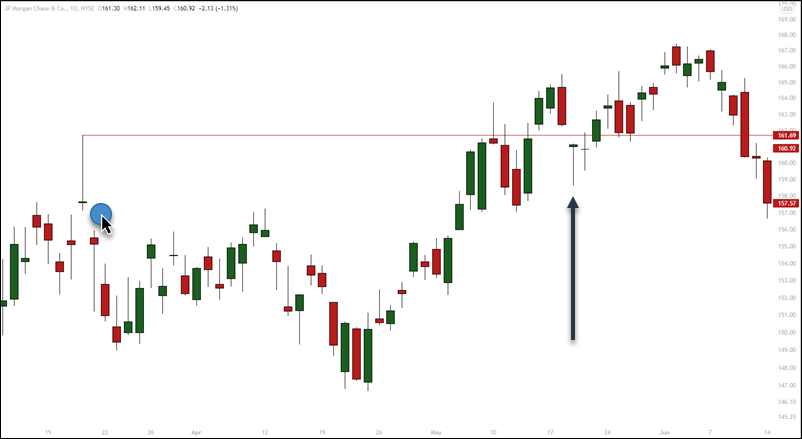
Great chart of JP Morgan. At the black arrow, price had gapped down after a momentum push to the upside. That is actually more bearish than bullish over a large sample of trades.
The dragonfly doji steps up at a former resistance level that is actually extremely close to a gravestone doji (blue circle). While not closing right at the lows, it had the same result acting as a bearish reversal. This is why I never show “perfect” anything in these posts. Close, is close enough.
Entry And Exits
Once you find one of the variations at a support or resistance zone and you decide to trade it, how do you actually enter and exit?
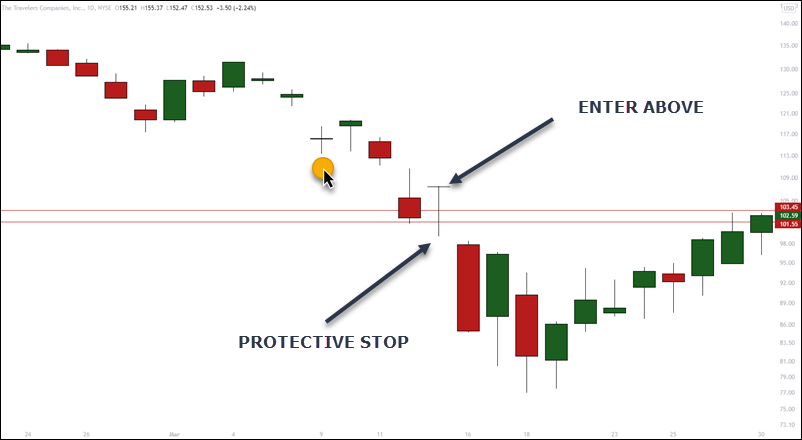
On this chart, we have a neutral doji with the orange dot. It does show up, although not marked, at a former swing pivot off to the left. A brief bounce, and reversal.
Our dragonfly doji shows up in the downtrend and at former support zones.
Your order to buy would be above the high. Protective stop below the low. Pretty simple.
Your Questions Answered
Can Doji Patterns Effectively Predict Cryptocurrency Market Movements?
While doji significance in crypto markets can indicate potential price reversals, you shouldn’t rely on them alone.
You’ll find these patterns are most effective when combined with other technical indicators and market context.
Remember that crypto’s high volatility can produce many false signals (fakeouts), so you’ll need to confirm doji patterns with subsequent price action and always use proper risk management strategies.
How Do Algorithmic Trading Systems Interpret and Respond to Doji Formations?
Trading algorithms scan for doji patterns by analyzing price data and comparing opening and closing values.
You’ll find that modern systems combine doji signals with other technical indicators for more reliable results. When they spot a doji, they’ll factor in volume, trend direction, and market context before executing trades.
Most algorithms won’t trade on doji patterns alone but use them as part of a comprehensive algorithmic analysis strategy.
What Percentage of Professional Traders Incorporate Doji Analysis in Their Strategy?
While exact trader percentages aren’t publicly available, you’ll find that roughly 60-70% of professional traders incorporate doji significance in their strategies.
You’ll notice this pattern’s popularity especially among technical analysts and day traders.
However, most don’t rely on doji patterns alone – they’ll typically combine them with other indicators for more reliable signals and validation of potential market moves.
Do Different Market Sectors Show Varying Reliability Rates With Doji Signals?
Yes, you’ll find that doji indicators perform differently across market sectors. High-volatility sectors like technology and cryptocurrencies often show clearer doji signals due to their frequent price swings.
In contrast, stable sectors like utilities and consumer staples may display fewer reliable doji patterns. Your success rate with doji analysis will typically be higher in sectors with active trading volume and greater price movement.
How Do Global Economic Events Impact the Reliability of Doji Patterns?
When major economic indicators are released or global uncertainty strikes, you’ll notice doji patterns become less reliable.
Market volatility increases during these events, causing rapid price swings that can create false signals.
You’ll want to wait for markets to settle and confirm your doji signals with other technical indicators.
During significant economic news, it’s best to be cautious and reduce your trading size.
Conclusion
You’ve now learned how to use doji candles to unlock valuable market observations. By understanding their formations, psychology, and proper time frames, you’re better able to spot potential trend reversals. Remember to combine doji signals with other technical indicators and always follow your risk management rules. While no pattern is perfect, doji candles can be powerful tools in your trading arsenal when used correctly.