- August 26, 2022
- Posted by: Shane Daly
- Category: Trading Article

When it comes to trading, there are a million and one strategies that you can use. However, one of the most important aspects of trading is technical analysis. While novice traders might shy away from using technical analysis due to its perceived complexity, it can be a very effective tool if used correctly.
Technical analysis aims to give traders an edge in the market by helping them to identify trading opportunities that they might not be able to find using just fundamental analysis of the market or an individual stock. Technical analysis can be used to trade both long-term and short-term trends, and can also be used to help you make decisions about when to enter and exit a trade.
Bottom line, it’s just another tool, but a powerful tool, that can be used to help guide your stock selections, entry points, exit points, and even the location of your protective stop loss.
TA is not infallible and it will not guarantee any percentage of winning trades. But to help put you on the right foot, I am going to give you 3 important tips to consider when using technical analysis.
Always Think In Probabilities When Making Trading Decisions
Many people think that trading is all about making quick, informed decisions and then cashing in on your profits. However, there’s another important aspect of trading that is often overlooked: probability.
Probability is the chance that something specific will happen, and it plays a crucial role in trading. Nothing is 100% in trading, nothing is guaranteed to predict future price movements, so it’s important to consider the likelihood of different outcomes when making trading decisions.
 For example, if you’re considering buying a stock due to the price action you are seeing, you’ll want to weigh the probability of the stock going up against the probability of it going down.
How do you do that?
Make sure you have a tested trading plan and ensure you are disciplined in following it whenever trading. For example, technical indicators such as support and resistance levels, moving averages, momentum indicators, and Keltner Channels can help give you an idea of the probability of a stock moving in a certain direction.
Candlestick chart patterns that show certain characteristics can point to one thing happening over another. For example, if price is coiling into a resistance zone, the probability is that price will break to the upside.
But it’s important to remember that technical analysis is not an exact science, and there will always be some element of risk involved. However, with proper planning and discipline, you can minimize those risks and increase your chances of success.
Identify The Long Term Trend
If you’re like most people, when it comes to trading, you’re always looking for the trend direction. After all, it’s the trend that provides the profits, right?
Yes, and no.
The trend is your friend only if you know how to identify it and trade with it. If you don’t, then the trend will quickly become your enemy.
Unfortunately, the trend direction is not always easy to identify. That’s because there are two types of trends: short-term and long-term. And as you might expect, they don’t always move in the same direction.
Different time frames can have different technical trends. Weekly charts can look different than daily charts. To make things even more difficult, trend direction can also change over time. Even if you’re able to identify the trend today, that doesn’t mean it will still be in place tomorrow. This is especially true for those who prefer day trading who may be using lower time frame charts.
You can even consider the trend on one timeframe as your main trend direction. On the lower time frame for setups, you’d use the higher timeframe trend direction for direction.
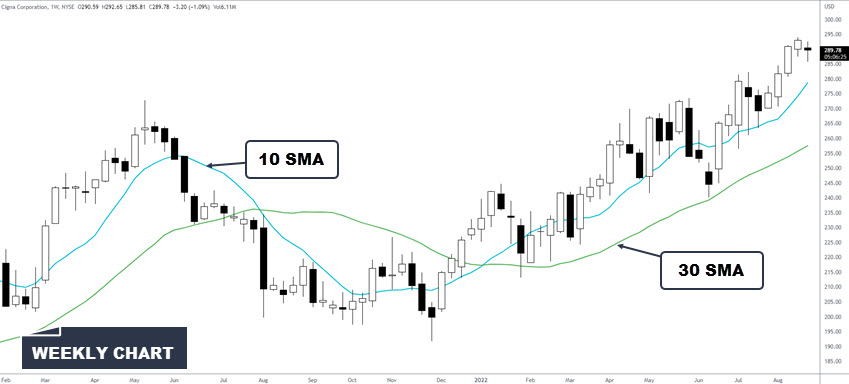
The good news is that there are a few techniques you can use to help identify trend direction. One popular tool is to look at moving averages of various lengths.
 Some examples of moving averages are:
10 SMA/30 SMA applied to the weekly charts
20/50 SMA for trend direction on the daily chart
Another option for traders is to use a moving average crossover for trend direction such as the 10/30 SMA cross.
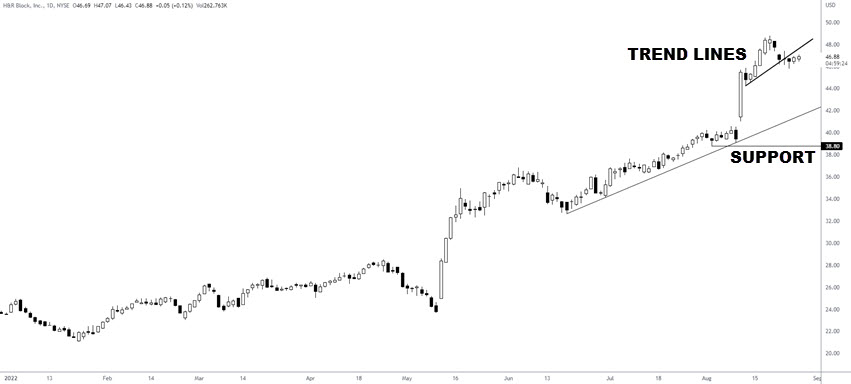
Some traders will use trend lines while others will use support and resistance levels.
 By using these techniques, you can give yourself a better chance of correctly identifying the trend direction and making profitable trades.
Have A Repeatable Trading Process
Before placing any trade, whether it’s a stock, cryptocurrency, or even just a simple options contract, it’s important to have a trading strategy in place. This strategy should be something that you can repeat and follow every time you make a trade. That way, you can ensure that you’re being consistent and disciplined with your trading.
Having a process in place will also help to remove some of the emotion from the equation. After all, it’s natural to feel emotionally attached to our trades. But if we allow our emotions to guide our trading decisions, we’re more likely to make impulsive and irrational decisions. These decisions can be profitable but in the long term, they are destructive.
Before you enter any trade, make sure you have a trading process in place that you can follow without fail. Doing so will help you to remain disciplined and avoid making costly mistakes.
 Always know the price levels where you will enter a trade.
Know your profit targets or your means of taking profits.
Ensure you know where you will exit your trade if proven wrong.
As long as you have a clear trading plan, one that’s been tested, has an edge and you can follow, you’ll be well on your way to becoming a successful trader.
However, before you start trading, make sure you understand what you’re getting into. You need to know the risks involved and the potential rewards.
Conclusion
These are three simple tips to help you get started with technical analysis and to make it work for you. Always think in probabilities when making trading decisions, identify the long-term trend, and have a repeatable trading process.
Do any of these resonate with you? If so, give them a try and see if they can improve on the results you are getting. Always remember, there is no one perfect way to trade – find what works best for you and stick with it.