- February 29, 2024
- Posted by: CoachShane
- Categories: Advanced Trading Strategies, Trading Article

A low-volume pullback is a temporary pause or brief retracement against the current trend, characterized by decreased trading volume. This signals potential exhaustion of the initial trend move before prices potentially resume the original direction.
 The low-volume pullback trading strategy offers a powerful technical analysis approach for traders to identify and capitalize on opportunities in the financial markets. Understanding this strategic method can help you make better decisions and improve your trading performance.
In this comprehensive guide, we will explore what low-volume pullbacks are, the key benefits of using this strategic approach, how to identify optimal entry points, how to manage risk through stop losses, volume analysis tools, and real-life trading examples.
Whether you are new to trading or looking to enhance your skills, this in-depth guide aims to provide the knowledge you need to master low-volume pullback trading.
What is a Low-Volume Pullback?
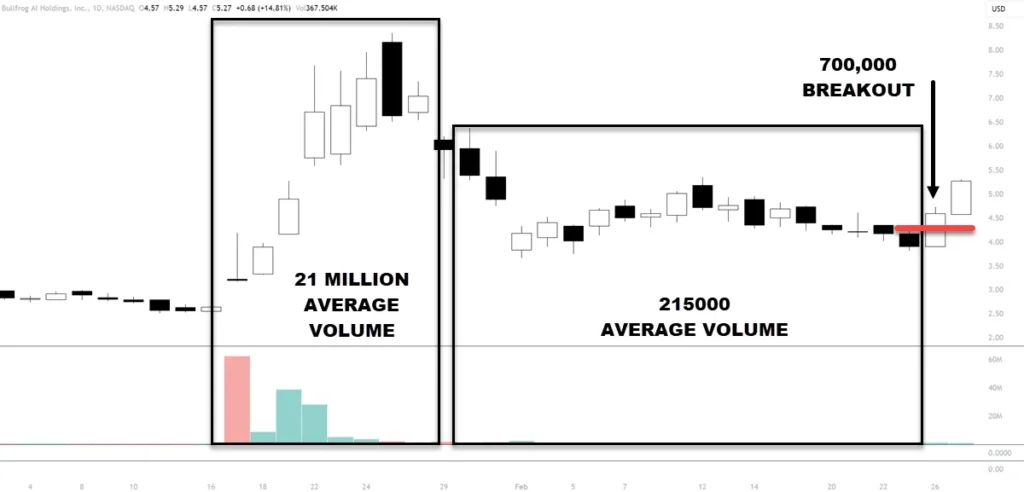 A low-volume pullback refers to a temporary pause or brief retracement in an established trend, characterized by decreased volume. Pullbacks start when the price moves against the prevailing trend, either slightly downward in an upward trend or upward in a downward trend.
The decreased trading volume during a pullback or consolidation signifies the potential temporary exhaustion of the initial trend move. As buyers or sellers temporarily pause, the price consolidates before potentially resuming the original trend direction.
Pullbacks are considered healthy in an uptrend or downtrend, providing necessary breathing room for the next market swing. By identifying low-volume pullbacks, traders can gain an edge in pinpointing strategic entry points to trade with the dominant market trend.
Benefits of Trading Low-Volume Pullbacks
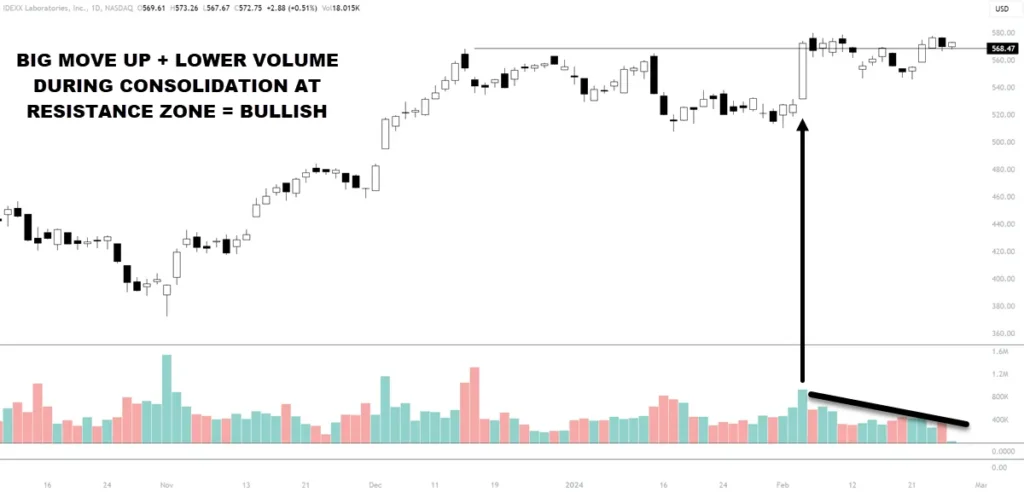 Understanding the art of trading low-volume pullbacks offers several advantages for traders:
- Confirmation of trend validity – The presence of a pullback/consolidation confirms the durability and strength of the overall trend. Lower volume shows bulls or bears are not overextending the move.
- Better risk-reward – Early entry during pullbacks allows a close stop loss with upside profit potential once the trend resumes. This improves risk management.
- Improved market timing – Identifying exhausted selling or buying enables traders to time market entries precisely just before trends pick up momentum again.
- Assessing market psychology – Observing how traders react during low-volume zones provides insights into overall sentiment for judging future moves.
- Momentum analysis – Detecting shifts in momentum helps traders diagnose the prevailing trend’s strength and anticipate potential reversals.
The confluence of these factors gives traders an advantageous edge in the markets.
Identifying Optimal Entry Points
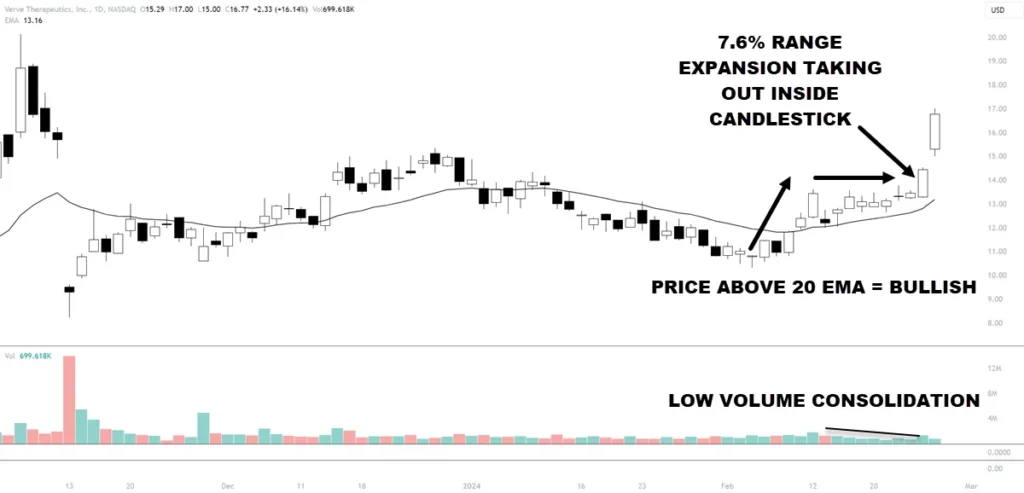 When analyzing volume patterns, these clues can help identify better entry points:
Candlestick Signals
Certain candlestick formations during pullbacks highlight intraday shifts in sentiment:
- Doji – The doji’s indecision indicates potential exhaustion after a trend.
- Hammer – The hammer’s upside rejection implies a bottom and higher prices.
- Bullish/Bearish Engulfing – These engulfing patterns show strong reversals in sentiment.
Trend Confirmation
Before entering, confirm the trend’s direction using analysis techniques like:
- Moving averages – A price above upward-sloping moving averages defines an uptrend.
- Trendlines – Valid reactions off ascending or descending trendlines confirm bullish or bearish moves respectively.
- Momentum oscillators – The price holding above the oscillator signal line (e.g. MACD) verifies the existing trend.
Volume Reduction
Check for decreasing volume on retracements and consolidations within the trend. Higher participation warns of potential exhaustion.
Support and Resistance
Watch for the price to bounce off recognized support or resistance zones. These reactions confirm buyers or sellers defending key levels.
Managing Risks with Stop Losses
The volatile nature of trading necessitates robust risk management rules. Stop loss placement is a “must do” technique traders use to limit downside risk.
A stop loss automatically triggers a market order to close your position once the price moves against you to a predefined level. Effectively setting stop losses helps protect your trading capital against excessive losses.
Here are some stop-loss techniques to consider:
- Fixed stop loss – Set a static price level based on a defined risk tolerance, for example, 50 pips in FX or $1.00 in stocks.
- Volatility stop loss – Base the stop on volatility, like 2-3x the Average True Range (ATR).
- Trailing stop loss – Trail the stop below support or above resistance to lock in profits as the trend extends.
- Percentage stop loss – Close the trade if it moves against you by a set percentage, such as 2% of capital.
Volume Analysis Tools and Indicators
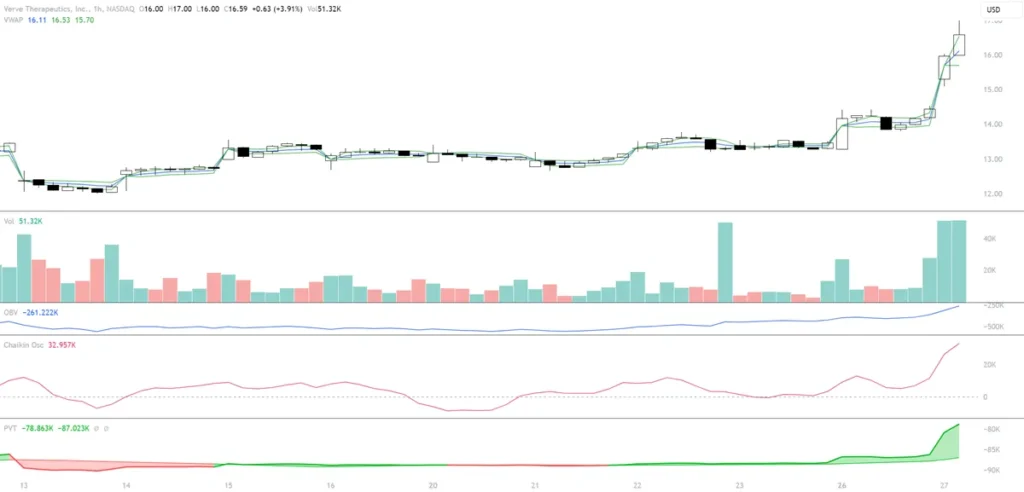 Specialized volume indicators and charts are indispensable for executing low-volume pullback strategies. Let’s explore some of the top volume analysis tools that you should put on your charts and test them out for your strategy:
Volume Oscillators
Volume oscillators like the Chaikin Oscillator compare volume momentum over defined lookback periods. They help assess the real strength or weakness behind price trends.
If the oscillator reaches extreme highs, it signals potential exhaustion, warning of pullbacks, or reversals.
On-Balance Volume (OBV)
OBV is a running cumulative total that adds volume on up days and subtracts it on down days. OBV shows divergences between price and volume flows.
For example, if the price rises but OBV declines, it indicates a weakening upside momentum.
Volume Moving Averages
Volume moving averages smooth out the data to reveal underlying volume trends. Comparing them to price action highlights reliable support or resistance zones.
Volume-Weighted Average Price (VWAP)
The volume-weighted average price benchmarks the average price weighted by volume across a specified timeframe. VWAP often acts as a support or resistance level.
Volume Price Trend (VPT)
VPT charts the volume flow in and out of a security. Spikes in VPT signify strong interest and potential for a price trend, while flat VPT signals disinterest.
Volume Charts
Volume charts visually compare price action to volume bars. Noticeable spikes in volume during breakouts or consolidations indicate traders entering or exiting positions. Analyzing volume surges relative to price trends offers a window into overall market sentiment.
Real-Life Low-Volume Pullback Trading Examples
Now let’s demonstrate low-volume pullback trading in action with real chart examples:
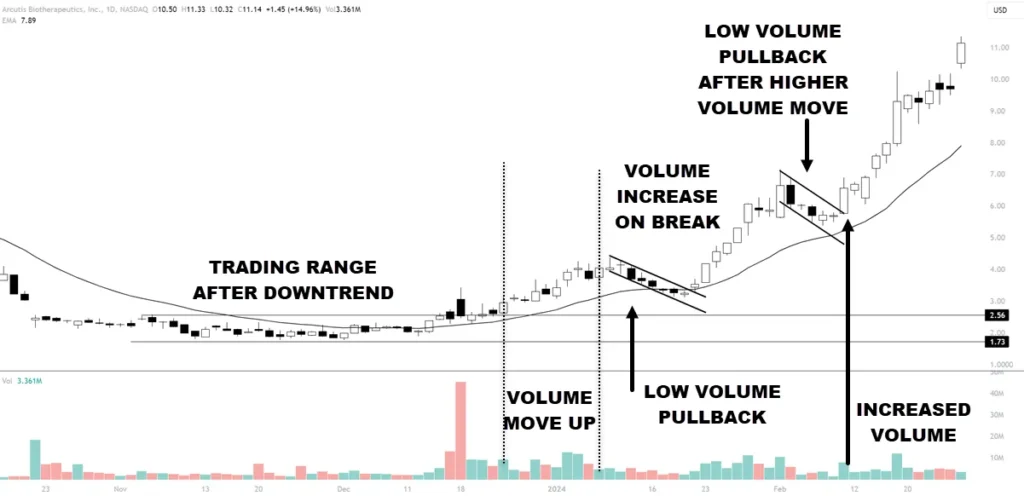
Uptrend Pullback This daily ARQT chart shows prices breaking from a trading range after a downtrend.
- Price makes a move up on rising volume and then forms a bull flag on lower volume.
- The break of the flag is done with increased volume leading to a 76% rise in price.
- Another high volume move-up occurs followed by another bull flag on lower volume.
- A break of the upper trendline on the flag leads to a 57% increase in price before consolidation.
Downtrend Pullback On this daily stock chart of WOLF, the price breaks to the downside with technical confirmation. Pullbacks are light in bullish volume and various entry techniques can be used including a break of support in the second pullback.
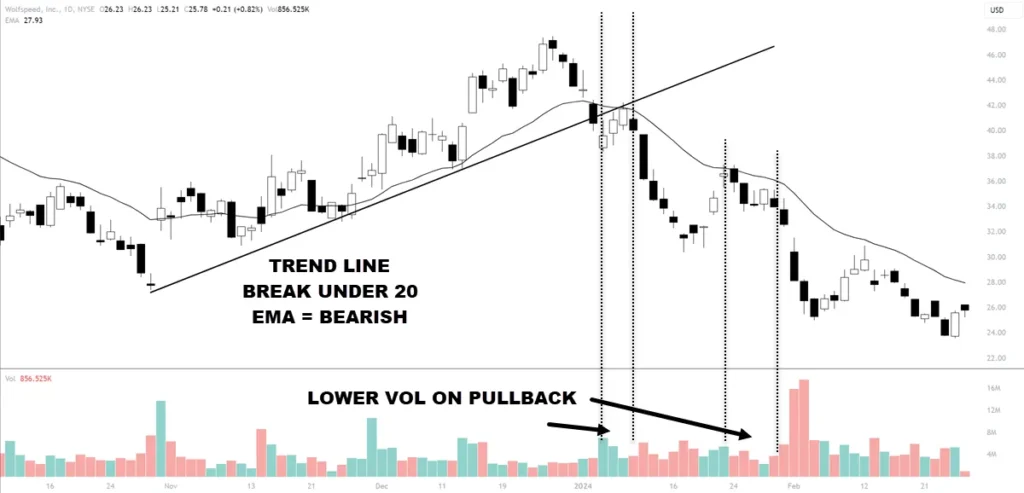 These examples demonstrate how volume analysis during pullbacks produces high probability entry points and controlled risk levels.
Key Takeaways and Summary
Let’s summarize the key lessons for effectively trading low-volume pullbacks:
- Confirm the trend – Accurately find the market trend using indicators like moving averages. Only trade pullbacks in the trend’s direction.
- Identify exhaustion – Look for decreasing volume during retracements as a sign of exhaustion and pending resumption.
- Define risk parameters – Incorporate stop losses and appropriate position sizing to limit capital risk.
- Time entries – Precision timing when entering trades leads to improved risk-reward outcomes.
- Utilize volume tools – Volume indicators highlight imbalances between volume and price for an added edge.
- Consider sentiment – Observe how participants react during pullbacks for clues on market psychology.
- Practice patience – Having the patience to wait for clear volume-based entry signals is paramount for success.
Mastering low-volume pullback analysis takes practice, but can ultimately help boost your trading profitability.
Frequently Asked Questions
Here are answers to some commonly asked questions about trading low-volume pullbacks:
What percentage moves qualifies as a pullback?
Pullbacks vary, but healthy retracements in an uptrend are often between 25-38% of the previous move. In downtrends, expect 38-50% counter-trend rallies.
How long do pullbacks last on average?
Pullbacks may last anywhere from a few hours to a few weeks depending on the security and timeframe. Generally, the longer the pullback duration, the more significant the reversal potential.
What volume decline is optimal?
Look for volume to decrease by at least 50% relative to the prior trending move. The larger the volume contraction, the more likely the pullback presents value.
Can you trade pullbacks on any timeframe?
Yes, pullbacks occur on 1-minute, 5-minute, hourly, daily, and weekly charts. Apply the low volume strategy on whichever timeframe aligns best with your trading plan.
How do I confirm the trend direction?
Combine techniques like moving averages, trendlines, and oscillators to accurately diagnose trends. Only trade in the direction of the prevailing trend.
Where should I place my stop loss?
Logical stop loss placement would be just outside the opposite support or resistance level that preceded the pullback. This defines your risk while giving room for normal retracements.
What is the minimum price movement for a pullback?
There is no set price minimum. But for significant moves, you generally want to see at least a 1-3% pullback on longer timeframes to warrant trading the correction.
Can you trade reversal patterns during pullbacks?
Yes, reversal candlestick patterns like doji, engulfing, or hammer often emerge around support/resistance during pullbacks, presenting high-probability setups.
How do I know when the pullback has ended?
Signs of pullback exhaustion include decreased volume, doji/spinning tops on the candles, and rejection of support/resistance back in the trend direction.
What other indicators can confirm pullback entries?
Oscillators like RSI or momentum indicators help identify oversold/overbought readings that signal pullback exhaustion before reversals.
Final Thoughts
The low-volume pullback strategy offers an insightful timing mechanism and an effective risk management approach for traders. Identifying exhausted selling or buying when volume contracts provide a valuable edge in planning market entries.
However, pullback trading requires solid technical skills, discipline, and experience. Use tight stop losses, allow profits to run, and stick to trading only high probability setups. With practice, trading volume pullbacks can boost your ability to capitalize on trend continuations and reversals.
Just remember to use risk and money management rules tailored to your account size and risk tolerance. This will help preserve your capital while you refine your low-volume pullback technique.

