- July 31, 2023
- Posted by: Shane Daly
- Categories: Trading Article, Trading Indicators

The On-Balance Volume (OBV) indicator is used to track buying and selling pressure. If the OBV rises, it suggests buying pressure, while a decline indicates selling pressure. Traders can confirm price trends by comparing OBV with the price chart. Divergences can signal potential reversals.
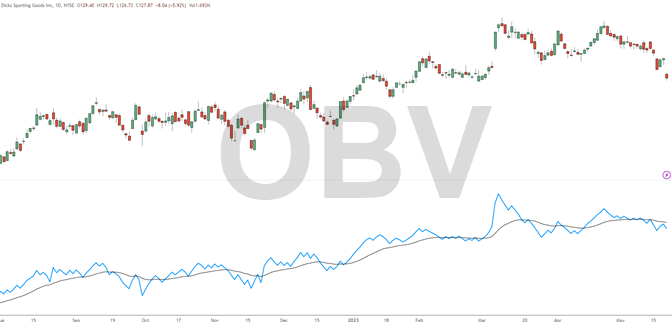
If you’re looking for a trading tool that can help you predict price movements and identify buying and selling pressure, look no further than On-Balance Volume (OBV). This technical indicator is based on the principle that volume precedes price, which means that changes in trading volume can be an early warning sign of price movements.
OBV was developed in the 1960s by Joseph Granville, a pioneer of technical analysis. It’s considered one of the most reliable indicators for measuring accumulation and distribution of assets in the financial markets.
Whether you’re an experienced trader or just starting out, understanding OBV can give you an edge in your investment strategies and help you tune into the market for better decisions about when to buy or sell.
Understanding OBV
On-balance volume (OBV) is a cumulative indicator that tracks the total volume of an asset over time. It reflects whether buyers or sellers are in control by analyzing the trend in trading volumes.
The OBV indicator with moving average is one way that traders use this tool to gain even more insight. This involves calculating the moving average of OBV over a chosen period, which helps identify trends and determine support and resistance levels.
 If the moving average line is trending upwards, it indicates bullish sentiment and the opposite is true for bearish sentiment.
By using OBV with other technical analysis tools, traders can get a clearer picture of market trends and make better-informed trades.
Calculation and Price-Volume Relationship
The OBV calculation is straightforward – it adds or subtracts trading volume based on whether the closing price for that day was higher or lower than the previous day’s closing price.
For instance, if todays closing prices of a stock stock is higher than previous close, then the day’s trading volume will be added to the cumulative OBV; if it closes lower, then the day’s trading volume will be subtracted.
This way, OBV reveals buying or selling pressure in a stock – if prices are rising on higher-than-average volumes, then it suggests buying interest and the smart money is involved. Falling prices on high volumes suggest selling pressure.
Studies have shown that stocks with higher OBV tend to outperform those with lower values over time, making it an important tool for traders and investors alike.
Importance in Trading
Using OBV, traders can identify trends and confirm breakouts by analyzing changes in buying or selling daily volume. For example, if an asset’s price is rising but the OBV line is showing negative volume flows, this indicates weakness in the market and an imminent reversal.
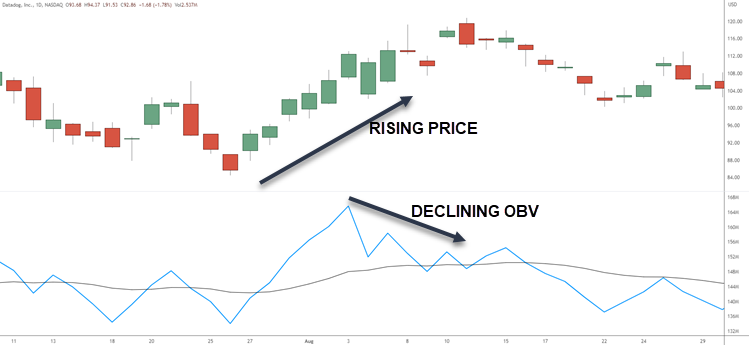 If an asset’s price is falling but the OBV line is rising, this indicates strong positive pressure.
By paying attention to these signals, traders can adjust their positions accordingly and potentially increase their profitability.
Buying and Selling Pressure
You can analyze the strength of buying or selling pressure in an asset by using this indicator.
When the OBV line moves up, it indicates that buying pressure is higher than selling pressure. When the OBV line moves down, it suggests that selling pressure is stronger than buying pressure.
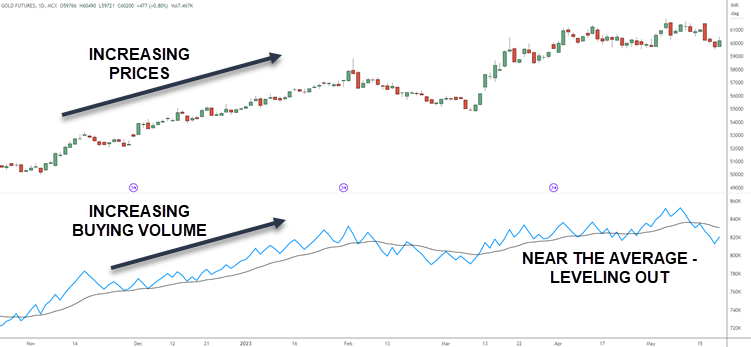 By analyzing these trends in volume and price action, traders may have enough information about buying or selling the asset.
For example, if the OBV line is rising while prices are going up, it suggests that there is strong buying interest in the market and traders may want to buy into this trend.
On the other hand, if prices are falling but the OBV line stays flat or rises slightly, it could suggest underlying demand for the asset and a potential opportunity to buy at lower levels.
Predicting Price Movements
One of the biggest advantages of this indicator is that it helps traders identify trends in buying and selling pressure, which can provide insight into future price movements.
By tracking changes in OBV over time, traders can gain a better understanding of market sentiment and adjust their strategies accordingly. It can also be used in conjunction with other technical indicators such as moving averages or MACD for further confirmation.
Trading Strategies with OBV
One trading strategy with OBV is to look for divergence. Divergence is when the price and OBV move in opposite directions. This occurs when there is a shift in supply and demand, which can indicate a potential trend reversal.
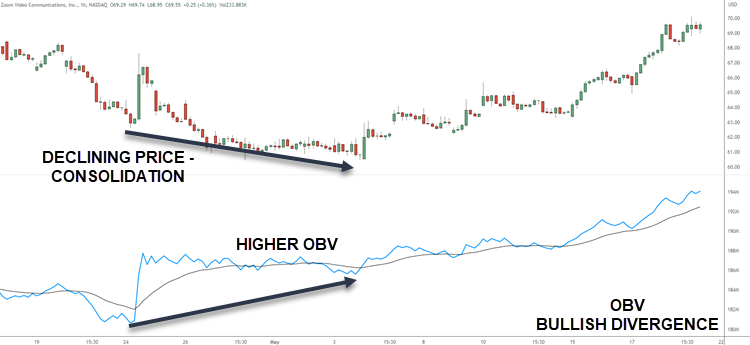 Here are three ways to identify divergences using OBV:
- Look for higher highs or lower lows on price charts but not on the OBV
- Look for lower highs or higher lows on the OBV chart but not on the price chart
- Look for trends that are weakening or strengthening on both charts, but at different rates
Divergence can be a powerful tool when combined with other volume indicators for day trading. By identifying divergence patterns early, you can make better-informed decisions about whether to enter or exit trades.
However, it’s important to note that divergences alone shouldn’t be used as a sole indicator of trade entry or exit points; they should be used in conjunction with other technical analysis tools such as trend lines, moving averages, and support/resistance levels.
Trend Confirmation
OBV can be used to confirm the price trend because it tends to rise during uptrends as buying pressure increases, and fall during downtrends as selling pressure increases.
To use OBV for trend confirmation, start by analyzing the price action on the chart. Look for higher highs and higher lows in an uptrend (price increases) or lower highs and lower lows in a downtrend (price decreases). Then, check whether the OBV is heading in the same direction as price.
In an uptrend, there should generally be more volume associated with up days than down days, causing OBV to rise steadily over time. Conversely, in a downtrend, there should be more volume associated with down days than up days, causing OBV to fall consistently over time.
By comparing price action with OBV readings, you can gain confidence that the trend is likely to continue or reverse. However, it’s important to note that while this is a commonly used rule of thumb, it’s not 100% accurate.
Comparing with Other Volume Indicators
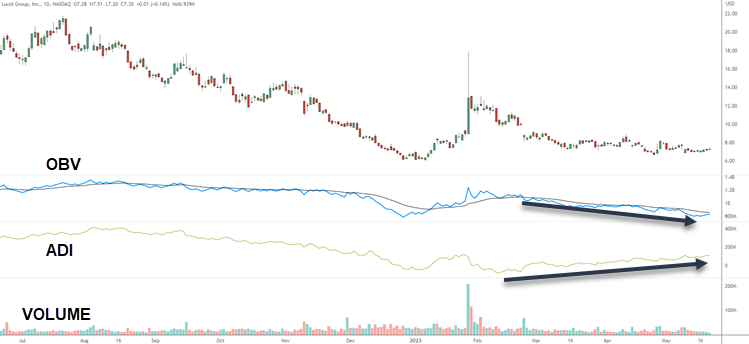
One indicator that we can use to compare is the accumulation distribution index (ADI), which factors in both price and volume to measure buying and selling pressure.
Similar to OBV, ADI is a cumulative indicator that adds or subtracts volume based on whether prices close higher or lower than the previous day’s close.
However, ADI places more weight on days with higher trading volumes, as it assumes that larger trades have a greater impact on market sentiment.
 Another popular indicator for confirming trends is the relative strength index (RSI), which compares the magnitude of price growth versus losses over a certain period of time.
RSI values range from 0 to 100, with readings above 70 indicating an overbought condition and readings below 30 indicating an oversold condition.
When used in conjunction with OBV, RSI can help confirm whether a trend is strong or weak by measuring the momentum behind price movements.
Advantages and Disadvantages
One advantage is that OBV is able to confirm price movements by analyzing changes in daily trading volume. This means that if prices are rising but volume is declining, it could indicate weakness in the trend.
If prices are falling but volume is increasing, it could suggest strength in the downward trend.
Another advantage of OBV is its ability to identify divergences between price and volume. For example, if price continues to rise while OBV begins to decline, it could be an indication that buying pressure is starting to weaken and a reversal may be on the horizon.
One disadvantage of OBV when compared with other volume indicators such as accumulation distribution is that it does not take into account intraday volatility or gaps in pricing.
Calculating on-balance volume can be more complex than other indicators which may prevent some traders from understanding and using this tool.
Also, this indicator is not suitable for day trading
OBV – Practical Guide
When examining on-balance volume, it’s important to remember that it tracks buying and selling pressure by analyzing changes in volume. As a result, traders can use this tool to confirm trends or identify potential price reversals.
- To begin, start by plotting the on-balance volume indicator on your chart.
- Look for instances where there is divergence between the indicator and price, such as when price is trending upwards but on-balance volume is trending downwards. This could indicate weakness in the trend and suggest a potential reversal.
- If both indicators are trending in the same direction such as up, this could provide confirmation of a strong bullish trend and signal an opportunity to enter or hold onto a position.
- Use your own trading tools and tactics to enter and manage these trades
Like any trading indicator, it is just a tool giving you information. What you do with that information will depend on your trading plan.
Common Misconceptions About OBV
There are some misunderstandings about OBV that could impact your trading success.
OBV only takes into account volume on up days.
OBV considers both volume on up days and volume on down days. The basic idea behind OBV is that it measures buying or selling pressure based on whether prices close higher or lower than the previous day’s close, as well as the volume of shares traded. So, if a stock price closes higher with high volume, OBV will increase; conversely, if a stock closes lower with high volume, OBV will decrease.
OBV should be used alone for trading decisions.
While it is a helpful tool in assessing market trends and identifying potential buy or sell signals, it’s important to use other technical indicators and analysis in conjunction with OBV before making a trading decision and putting risk in the market.
OBV predicts price movements.
While it can give clues as to where prices may go, it is not a crystal ball and should not be relied upon solely for trading decisions. Instead, think of OBV as a tool that measures buying and selling pressure in the market. By adding up volume on up days and subtracting volume on down days, OBV creates a line that tracks overall buying or selling pressure over time.
OBV is interchangeable with other momentum indicators.
like accumulation distribution or money flow index. While these indicators like accumulation distribution or money flow index are similar in nature, they each have their own unique formulas and ways of measuring buying and selling pressure. For example, accumulation distribution takes into account both price movement and volume, while money flow index only looks at the rate of change in price.
Case Studies
Here are some real-life examples of on-balance volume (OBV) in action. These case studies will hit on what we have discussed to help you make a decision whether to use it in your own trading.
DIGITAL TURBINES
One example of OBV in action is during an uptrend. As the price of a stock rises, so does its OBV line, indicating increasing buying pressure and the current trend may continue. During a downtrend, the OBV line will fall as selling pressure increases.
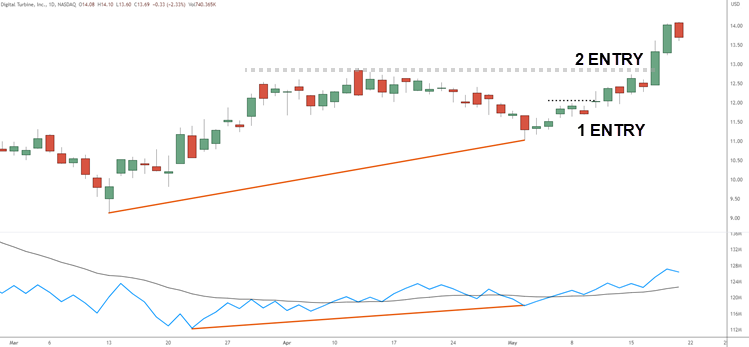
This chart we see higher lows in price with an increase in the OBV. This is setting up bullish trade conditions.
Price rallies off the lows and then pauses at 1 entry. The OBV is above the 20 day EMA setting up an entry for a breakout above the pause. I call this a nested consolidation as it appears off of a rally in price.
2 entry is a standard resistance zone breakout that is accompanied by an increase in the OBV line above the moving average.
PINTREST
Another example is when there is divergence between price and OBV – if prices are rising but the OBV line is falling, it could indicate that bullish momentum is weakening and a trend reversal may be imminent – bearish divergence.
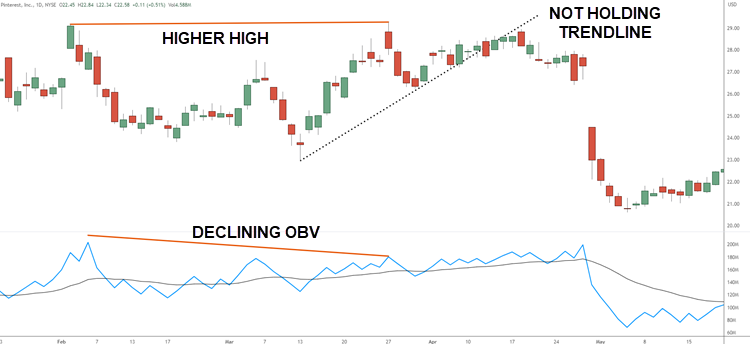 If prices are falling but the OBV line is rising, it could signal a potential trend reversal to the upside – bullish divergence.
This example has price making higher highs while the indicator is declining. Adding to this information that points to a bearish reversal, we see price unable to hold the upside of a trendline. There a few ways to enter this trade including during the pause before the gap down.
Overall, incorporating OBV analysis into your trading strategy can provide valuable insights into market trends and help you make more profitable trades.
Frequently Asked Questions
What does “on-balance volume” refer to?
On-Balance Volume (OBV) is a technical analysis indicator that tracks price and volume changes to understand if money is being accumulated or distributed in security, helping to predict price movements.
Is the on-balance volume indicator considered effective?
Yes, the OBV indicator is considered effective for signaling potential price reversals and confirming price trends, but it should be used with other indicators for confirmation.
How does on-balance volume differ from regular volume?
While regular volume measures the total amount of shares traded, OBV links volume to price changes, distinguishing whether the volume is pushing the price up or down.
Are there any indicators that outperform OBV?
There are many indicators, such as Relative Strength Index (RSI), Moving Average Convergence Divergence (MACD), and Volume Price Trend (VPT), that may outperform OBV depending on the user’s strategy and understanding of price action.
Why does on-balance volume sometimes show negative values?
OBV shows negative values when the closing price is lower than the previous day’s close, signifying distribution or selling pressure.
What sets OBV apart from the accumulation indicator?
OBV differs from the accumulation/distribution indicator by the way it is calculated. OBV applies the entire day’s volume to the trend, while the accumulation/distribution indicator applies a portion of the day’s volume based on the close price.
Is the VPT (volume price trend) indicator superior to the OBV indicator?
Whether VPT is superior to OBV is subjective and depends on the trader’s strategy and the market conditions. Both track volume and price changes, but VPT also includes price movement magnitude, potentially offering more insights.
Conclusion
Understanding the On-Balance Volume (OBV) can greatly benefit you during your trading day. By calculating the relationship between price and volume, you can determine buying and selling pressure in the market and predict future price movements.
Real-world examples show how OBV has been used to successfully predict price movements in various markets. However, it’s important to remember that no indicator should be used alone, and additional analysis should always be conducted before making any trades.
Coincidentally, incorporating OBV into your trading strategy can lead to a more well-rounded approach that takes into account both technical indicators and fundamental analysis. With careful consideration and research, OBV can become a valuable tool for traders looking to make informed decisions in the market.
