- March 25, 2024
- Posted by: Shane Daly
- Categories: Basic Trading Strategies, Trading Article
Range trading is a trading strategy that involves identifying a price range that an asset typically trades within and then making trades around the support and resistance levels of that range. The idea is that prices tend to bounce between these levels until a clear breakout occurs.
 Here’s how range trading generally works:
- Identify the range: Analyze the price chart to find the support and resistance levels that define the range. Support is the price level where buying pressure tends to overcome selling pressure, causing the price to rise. Resistance is the opposite – it’s where selling pressure typically exceeds buying pressure, causing the price to fall.
- Wait for the price to reach support or resistance: Once you’ve identified the range, wait for the price to reach either the support or resistance level.
- Enter a trade: If the price reaches the support level and you see signs it will hold, you could enter a long trade (buy). The same is true when it reaches resistance, you could enter a short trade (sell).
- Set a stop loss and take profit: Place a stop loss order beyond the opposite side of the range to limit your potential loss if the trade goes against you. Set a take profit order near the opposite side of the range to exit the trade profitably if the price reaches that level.
- Manage the trade: Monitor the trade and be prepared to exit if the price breaks out of the range or if market conditions change.
Some key points about range trading:
- It works best in markets that are ranging, not trending. Trending markets often break through support and resistance levels.
- The range should be well-established, with the price having bounced off the support and resistance levels multiple times.
- Ranges can be found on any timeframe, but they’re often more reliable on higher timeframes like the 4-hour, daily, or weekly charts.
- Risk management is key. Always use a stop loss and don’t risk too much on any single trade.
Range trading can be an effective strategy in the right market conditions, but it requires patience, discipline, and good risk management. It’s important to remember that no strategy works all the time, and range trading is no exception.
How Do You Identify Support And Resistance Levels For Range Trading?
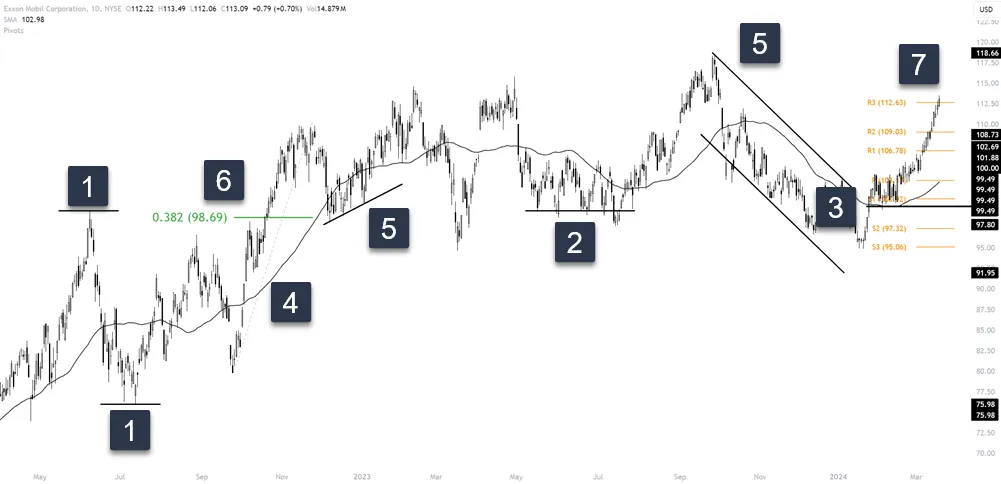 Identifying support and resistance levels is a needed skill for range trading. These levels form the boundaries of the trading range and provide the entry and exit points for your trades. Here are some methods you can use to identify support and resistance:
- Swing highs and lows: One of the most basic ways to find support and resistance is to look for swing highs and lows on the price chart. A swing high is a candlestick with at least two lower highs on both the left and right of it. A swing low is the opposite – it’s a candlestick with at least two higher lows on both sides. The swing lows can act as support levels, while the swing highs can act as resistance levels.
- Horizontal lines: Draw horizontal lines across the chart at price levels where the price has reversed multiple times. The more times the price has bounced off a level, the more significant that level is.
- Round numbers: Prices often find support and resistance at round numbers like 1.2000, 1.2500, and 1.3000 in forex, or 100, 200, and 500 in stocks. These levels often attract a lot of orders, which can make them act as strong support and resistance.
- Moving averages: Moving averages can also point to price support and resistance levels. Prices will often bounce off an area around a moving average or find resistance at it. Look left to find the price structure. Common moving averages to watch are the 20, 50, 100, and 200-period moving averages.
- Trendlines: If the price is in an uptrend, you can draw a trendline connecting the swing lows. This rising trendline can act as a dynamic support. In a downtrend, you can connect the swing highs to create a falling trendline that acts as a dynamic resistance.
- Fibonacci levels: Fibonacci retracement levels like 38.2%, 50%, and 61.8% can also act as support and resistance. These are best used in conjunction with other methods.
- Pivot points: Pivot points are calculated using the previous period’s high, low, and close prices. The central pivot point and its associated support and resistance levels can be useful for range trading.
When identifying support and resistance, think about these:
- The more times a level has been tested, the more significant it is.
- Look for clusters of support and resistance. If several methods point to the same level, that level is likely to be significant.
- Support and resistance levels are not exact. Think of them more as zones or areas.
- When a support or resistance level is broken, it often becomes the opposite. For example, if the price breaks above resistance, that resistance level may become support.
No method of identifying support and resistance is perfect. Failed breakouts can occur, and levels that have held in the past can break. Always use stop losses and be prepared to adapt your levels as market conditions change.
What Are The Best Timeframes For Range Trading?
The timeframe you choose will influence the type of ranges you can trade, the frequency of your trades, and the potential profit from each trade. Here’s a breakdown of different timeframes and their suitability for range trading:
| Timeframes | Characteristics |
|---|---|
| Lower timeframes (1 minute to 15 minutes) | – Very short-term ranges often based on market noise. – High trading frequency, leading to overtrading and higher transaction costs. – Smaller profit potential per trade. – Can be stressful and time-consuming to monitor. – Generally not recommended for range trading. |
| Medium timeframes (30-minute to 4-hour) | – More reliable ranges than lower timeframes. – Moderate trading frequency, balancing trading opportunities and analysis time. – Decent profit potential per trade. – Requires less constant monitoring than lower timeframes. – Suitable for range trading, especially for day traders. |
| Higher timeframes (Daily, Weekly, Monthly) | – Most reliable ranges, based on significant long-held levels. – Low trading frequency, with longer-lasting trades. – High profit potential per trade due to larger ranges. – Requires patience and a long-term outlook. – Ideal for swing or position traders with a longer-term approach. |
Which timeframe is best? It largely depends on your trading style, the amount of time you can dedicate to trading, and your personality. However, for most range traders, the higher timeframes (daily and above) are preferred for several reasons:
- The ranges are more reliable and based on significant levels.
- The noise of short-term price fluctuations is filtered out.
- You don’t need to constantly monitor the markets.
- Each successful trade has the potential for a substantial profit.
That said, the 4-hour timeframe can also be a good choice, particularly if you want to trade more frequently or if the markets you trade don’t form clear ranges on the higher timeframes.
Ultimately, the best approach is to experiment with different timeframes to see which works best for you. You might find that a combination of timeframes works well, such as using the daily chart to identify the range and then using the 4-hour chart to time your entries and exits.
Regardless of the timeframe you choose, always use a stop loss and risk only a small percentage of your trading account on each trade. Effective risk management is an important skill for successful range trading in any timeframe.
How Do You Determine Entry Points For Range Trading?
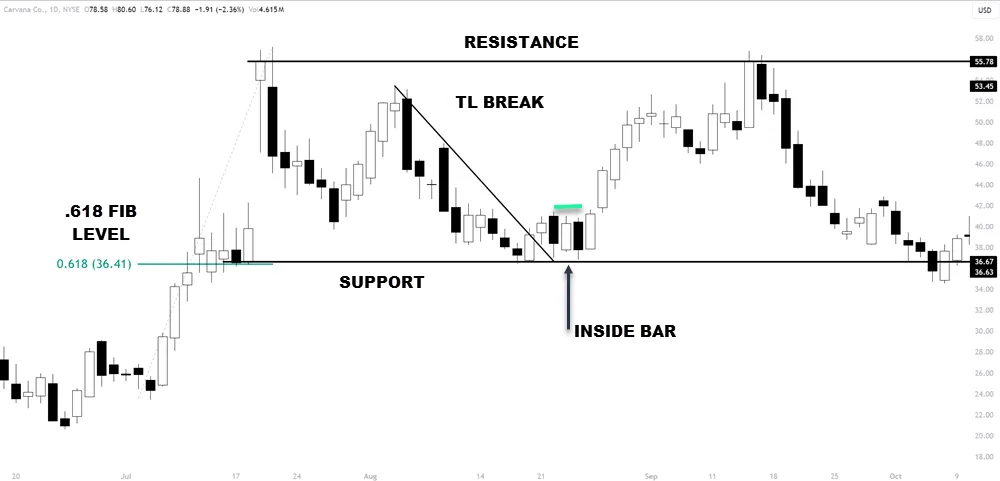
The goal is to enter trades at levels where the price is likely to reverse – near support when going long, or near resistance when going short. Here are some methods for determining entry points:
- Bounce-off support or resistance: One of the simplest entry methods is to wait for the price to bounce off a well-established support or resistance level. For a long trade, you would enter when the price bounces up off support. For a short trade, you would enter when the price bounces down off resistance.
- Candlestick patterns: Certain candlestick patterns can indicate a potential reversal at support or resistance. For example, a pin bar (also known as a hammer or shooting star) with its wick extending beyond the support or resistance level and then closing back within the range could signal a reversal.
- Divergence: Divergence occurs when the price makes a new high or low, but an oscillator like RSI or MACD does not confirm this move. This can signal a potential reversal. For example, if the price makes a new low at support but the RSI makes a higher low, this bullish divergence could be a signal to enter a long trade.
- Breakout and retest: If the price breaks out of the range but then quickly moves back into it, this can offer an entry opportunity. For example, if the price breaks below support but then moves back above it, you could enter a long trade, treating the old support level as a new resistance level.
- Fibonacci levels: If the price is bouncing within a range, Fibonacci retracement levels can offer potential entry points. For example, if the price is rising from support to resistance, you could look for a pullback to the 38.2%, 50%, or 61.8% Fibonacci levels to enter a long trade.
- Confluence: Confluence refers to when multiple factors come together to support a trade. For example, if the price bounces off support and breaks a trendline, and this support level aligns with a Fibonacci level and a bullish divergence on RSI, this confluence increases the probability of a successful long trade.
When determining entry points, keep these guidelines in mind:
- Wait for confirmation: Don’t enter a trade just because the price has reached support or resistance.
- Wait for confirmation in the form of a bounce, a candlestick pattern, or divergence.
- Use multiple timeframes: Check higher timeframes to ensure your entry aligns with the broader trend. For example, if you’re trading a range on the 4-hour chart, check the daily chart to make sure the overall trend is not against you.
- Have a clear plan: Before entering a trade, know your entry point, and stop loss level and profit target. Stick to this plan.
No entry will ever be perfect which is why having a stop loss is important when trading any strategy.
What Are Some Effective Stop-Loss Strategies For Trading Ranges?
A stop loss is an order that automatically closes your trade if the price moves against you by a certain amount. It’s designed to limit your potential loss on a trade. Here are some strategies for setting stop losses when range trading:
| Strategy | Description |
|---|---|
| Outside the range | Set the stop loss just outside the opposite side of the range. For long positions near support, place it just below resistance. For short positions near resistance, place it just above support. |
| ATR (Average True Range) | ATR measures the average size of recent price moves. Use a multiple of ATR to set your stop loss, e.g., 2x ATR means setting the stop loss 100 pips away if the current ATR is 50 pips. |
| Swing high/low | Place the stop loss beyond the most recent swing high (for short trades) or swing low (for long trades). This guards against being stopped out by normal price fluctuations within the range. |
| Support/resistance levels | Use minor support or resistance levels within the range to place your stop loss. For example, if going long at major support, place it below a minor support level within the range. |
| Percentage of account | Set the stop loss based on a percentage of your trading account to manage overall risk. For instance, if you risk 1% of your account on a trade, place the stop loss at a level where you’d lose 1%. |
When setting stop losses, keep these points in mind:
- Give the trade room to breathe: Don’t place your stop loss too close to your entry point, as this can lead to getting stopped out by normal price fluctuations.
- Avoid obvious levels: If your stop loss is at a level that’s obvious to many traders (like a major round number), it could be vulnerable to being run by the market.
Best 5 Take-Profit Strategies For Range Trading
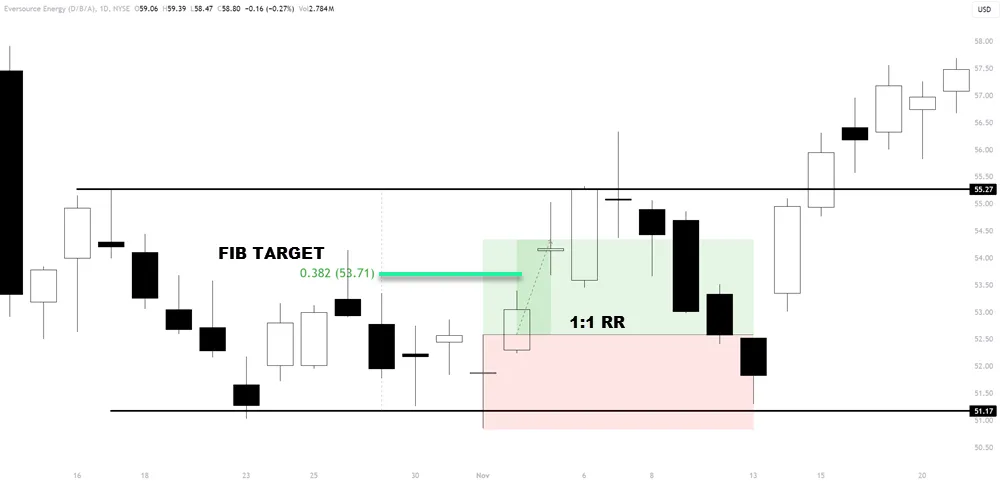 Setting take profit levels is just as important as setting stop losses when range trading. Your take profit is the level at which you’ll exit a trade with a profit if the market moves in your favor. Here are some strategies for setting take profit levels:
- The opposite side of the range: The most basic approach is to set your take profit near the opposite side of the range. If you’re going long at support, you’d set your take profit just below resistance. If you’re going short at resistance, you’d set your take profit just above support. This way, you’re aiming to capture most of the range.
- Fibonacci levels: Fibonacci levels can be used to take profits as well as entries. For example, if you’re going long at support, you could set take profits at the 38.2%, 50%, and 61.8% Fibonacci retracement levels between support and resistance.
- Risk-reward ratio: Another approach is to set your take profit based on a risk-reward ratio. For example, if your stop loss is 50 pips away from your entry, and you want a 1:1 risk-reward ratio, you’d set your take profit 50 pips away from your entry.
- Trailing stop: A trailing stop is a stop loss that moves in your favor as the price moves. You can use a trailing stop to lock in profits as the trade moves in your favor. For example, you could set a trailing stop 50 pips below the highest price reached after you enter a long trade.
- Partial profits: Instead of closing your entire position at one take profit level, you can scale out of the trade by taking partial profits at different levels. For example, you could close half of your position at the first profit level and let the rest run to the next level.
When setting take profits, consider these factors:
- Be realistic: While it’s tempting to aim for the maximum possible profit, the price won’t always reach the opposite side of the range. Sometimes, it’s better to aim for a smaller, more realistic target.
- Consider the risk-reward: Ensure that your potential reward justifies the risk you’re taking. A minimum 1:1 risk-reward ratio is often recommended, but 2:1 or higher is preferable.
- Adapt to market conditions: In volatile markets, you may need to set closer take profits. In quieter markets, you may be able to aim for targets further away.
Remember, setting take profits is about finding a balance between letting your profits run and ensuring you realize those profits. It’s better to consistently take smaller profits than to constantly aim for home runs and end up with nothing.
How Do You Manage Trades When The Price Is Range-Bound?
Trade management is a critical aspect of successful range trading. It involves monitoring your trades, adjusting your stop losses and take profits, and deciding when to exit a trade. Here are some tips for managing trades when the price is ranging:
| Strategy Element | Description |
|---|---|
| Monitor the trade | Keep an eye on the price action after entering a trade. Watch for signs of the range breaking down, like increasing volatility or the price lingering near range edges. |
| Trail your stop | Move your stop loss to lock in profit as the trade favors you. For instance, if long and the price reaches halfway to your take profit, adjust your stop loss to your entry point. |
| Partial profits | Take partial profits if the price hits a significant level within the range (e.g., a Fibonacci level). This secures some profit even if the price doesn’t reach the full take profit target. |
| Be prepared to exit | Be ready to exit quickly if the price breaks out of the range against your trade. Don’t rely on the price returning to the range; a breakout could indicate a new trend. |
| Use multiple timeframes | Monitor higher timeframes in addition to your trading timeframe. Breakdowns in ranges on higher timeframes can impact your trade on the lower timeframe. |
| Adjust to market conditions | Range trading works best in quiet, stable markets. If volatility increases or a major news event is approaching, consider tightening your stops, reducing your position size, or avoiding new trades until the market settles. |
| Stick to your plan | Have a clear plan for entry, stop loss, and take profits before entering a trade. Stick to this plan unless there’s a clear reason to deviate. Avoid moving your stop loss further away from your entry, as this increases your risk. |
| Keep a trade journal | Record your trades, including reasons for entering, stop loss, and take profit levels and the trade outcome. Regularly review your journal to learn from successes and mistakes. |
Remember, even the best range traders have losing trades. The key is to manage your risk on each trade and to consistently apply your strategy. With proper trade management, you can maximize your profits from successful trades and minimize your losses from unsuccessful ones.
What Indicators Can Be Used To Confirm Range-Bound Markets?
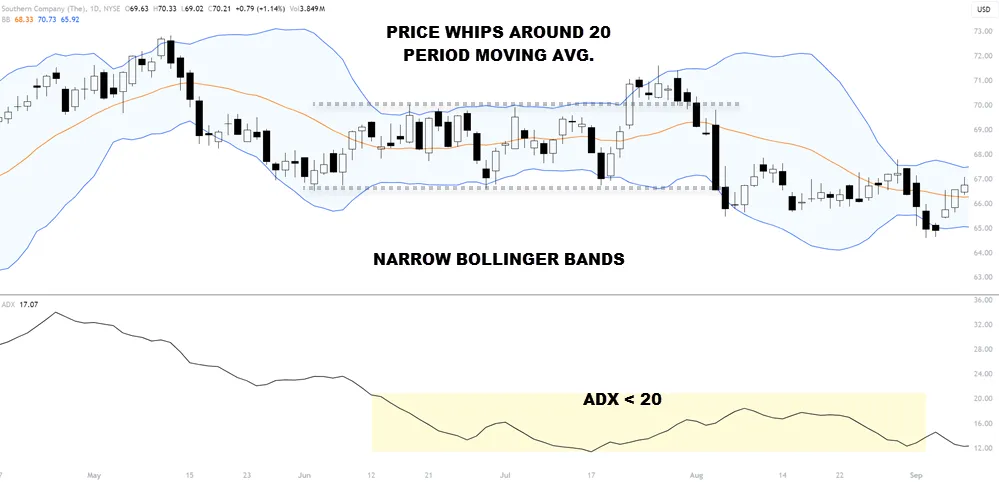
While price action is the primary tool for range trading, indicators can be used to confirm that the market is range-bound. Here are some indicators that can be helpful:
- Average True Range (ATR): ATR measures the volatility of the market. In a range-bound market, the ATR will typically be low and stable. If the ATR starts to increase, it could be a sign that the market is breaking out of the range.
- Bollinger Bands: Bollinger Bands are a volatility indicator that consists of a moving average and two standard deviation lines above and below it. In a range-bound market, the price will typically oscillate between the upper and lower bands. If the price starts to break out of the bands, it could signal the end of the range.
- Relative Strength Index (RSI): RSI is a momentum indicator that measures the speed and change of price movements. In a range-bound market, the RSI will typically oscillate between 30 and 70. If the RSI breaks above 70 (overbought) or below 30 (oversold) and stays there, it could indicate a breakout.
- Stochastic Oscillator: The Stochastic Oscillator is another momentum indicator. In a range-bound market, it will typically oscillate between 20 and 80. Crossovers of the %K and %D lines can indicate potential reversals within the range.
- Moving Averages: Moving averages can help to identify the direction of the trend. In a range-bound market, the price will typically oscillate around a moving average. If the price starts to consistently trade above or below the moving average, it could signal the start of a new trend.
- ADX (Average Directional Index): ADX measures the strength of a trend. In a range-bound market, the ADX will typically be below 25. If the ADX starts to rise above 25, it could indicate that a new trend is starting.
When using trading indicators, keep these points in mind:
- Confirm with price action: Indicators should be used to confirm what you’re seeing in the price action, not to replace it. Always look at the price chart first.
- Use multiple indicators: No single indicator is perfect. Using multiple indicators can give you a more robust signal.
- Adjust settings: The default settings of indicators may not always be the best for the market you’re trading. Experiment with different settings to find what works best.
- Be aware of lag: Most indicators are lagging, meaning they’re based on past price data. They can confirm that a range exists, but they may not predict when it will end.
Indicators are tools to assist your trading decisions, not to make them for you. Always use indicators along with price action and your analysis. Never rely on an indicator signal alone to enter or exit a trade – always have a clear plan for your trade based on your overall strategy.
How Do You Handle False Breakouts?
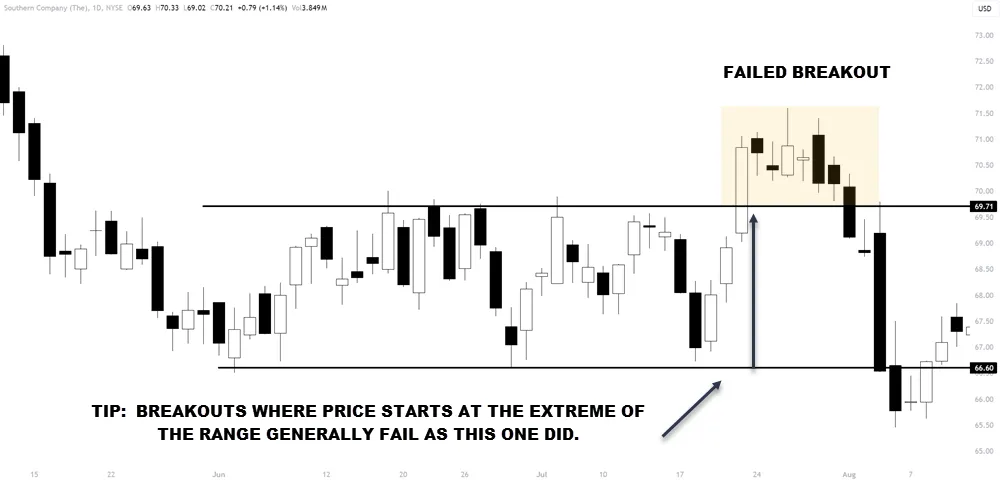 A false breakout (properly known as a failed breakout) occurs when the price appears to break out of the range, but then quickly reverses and moves back into the range. These can lead to losing trades if not handled properly.
Here are some strategies for dealing with false breakouts:
- Wait for confirmation: Don’t enter a trade immediately after a breakout. Wait for confirmation that the breakout is genuine. This could be in the form of a closed candle outside the range, increased volume, or a break of a key level beyond the range.
- Use a breakout confirmation indicator: Indicators like the Average Directional Index (ADX) can help confirm if a breakout is likely to be genuine. An ADX reading above 25 indicates a strong trend, which could confirm a breakout.
- Look for divergence: If the price breaks out but an oscillator like RSI or MACD doesn’t confirm the move (i.e., it shows divergence), this could be a sign of a false breakout.
- Check higher timeframes: A breakout on a lower timeframe might just be noise within a range on a higher timeframe. Always check higher timeframes to see the bigger picture.
- Use wide stops: If you do enter a breakout trade, use a wide stop loss. This gives the trade room to breathe and can prevent you from being stopped out by a minor pullback.
- Have a plan for failure: Before entering a breakout trade, know what you’ll do if it turns out to be a false breakout. Will you exit immediately, or give it a certain amount of room? Having a plan can help you manage false breakouts effectively.
- Consider fading the breakout: Some traders trade in the opposite direction of breakouts, expecting them to fail. This is known as fading the breakout. If you see a breakout but the momentum seems weak, you could consider entering a trade in the opposite direction, expecting the price to move back into the range.
- Manage your risk: Regardless of your strategy for dealing with false breakouts, always manage your risk. Use stop losses, and don’t risk too much on any single trade.
No strategy can avoid failed breakouts entirely. The key is to have a plan for handling them and to always control your risk. With experience, you’ll get better at identifying genuine breakouts and avoiding the ones that have a lower probability of succeeding.
Top 10 Common Mistakes When Range Trading
Range trading can be a profitable strategy, but it’s not without its pitfalls. Many traders, especially beginners, commit common mistakes. The point is to learn from them.
Here are some of these mistakes and how to avoid them:
- Trading ranges that are too small: Each trade incurs costs in the form of the spread and potential slippage. If you’re trading a range that’s too small, these costs can eat into your profits significantly. Ensure the range is large enough to cover your costs and provide a reasonable profit.
- Ignoring the broader trend: A range on a lower timeframe might just be a pause in a larger trend on a higher timeframe. Always check higher timeframes to see the bigger picture. If the broader trend is against your trade, you’re fighting an uphill battle.
- Chasing entries: It can be tempting to chase a trade if you miss your initial entry. But entering late, after the price has already moved significantly, reduces your potential reward and increases your risk. Wait patiently for clear entry signals.
- Not using stop losses: Stop losses are a safeguard for managing risk. Without a stop loss, a single bad trade could wipe out your account. Always use a stop loss, and place it at a level that invalidates your trade idea.
- Moving stop losses: Some traders move their stop losses further from their entry as the trade goes against them, hoping the price will turn around. This is a dangerous practice that can lead to large losses. Once you place your stop loss, leave it be unless you have a clear, pre-defined reason to move it.
- Overtrading: Range markets can be slow, with long periods of little movement. Some traders get impatient and start taking trades that don’t meet their criteria, just to be in the market. This is a recipe for losses. Only take trades that align with your strategy.
- Not adapting to changing conditions: Market conditions can change quickly. A range that has held for weeks can suddenly break down. Always be prepared to adapt your strategy as conditions change.
- Risking too much: Overconfidence can lead traders to risk too much on a single trade. No trade is ever a sure thing. Always manage your risk, and never risk more than you can afford to lose.
- Neglecting fundamentals: While technical analysis is the primary tool for range trading, fundamental factors can still impact the market. Major news events or shifts in economic conditions can cause ranges to break down. Always be aware of key fundamental events that could affect your trades.
- Emotional trading: Emotional responses like fear, greed, and hope can lead to poor trading decisions. Successful trading requires a disciplined, unemotional approach. Stick to your strategy, and don’t let emotions sway your decisions.
To avoid these mistakes, you need to have a well-defined trading plan and the discipline to stick to it. Your plan should include:
- The criteria for identifying tradable ranges
- Your entry and exit rules
- Your risk management rules, including position sizing and stop loss placement
- The conditions under which you’ll adjust or exit a trade
In addition, keep a trading journal to record and review your trades. This can help you identify mistakes and areas for improvement.
Remember that range trading, like any trading strategy, is not infallible. Losses are a part of trading. The key is to manage your risk so that no single trade or series of trades can significantly damage your account. With discipline, patience, and continuous learning, you can avoid common mistakes and improve your range trading skills over time.
Summary
Range trading can be a profitable strategy for trading markets that are oscillating between support and resistance levels. By understanding how to identify ranges, enter and exit trades, and manage risk, traders can take advantage of the back-and-forth price action in range-bound markets.
However, range trading is not without its challenges. Failed breakouts, changing market conditions, and emotional responses can all lead to losing trades. To succeed as a range trader, it’s essential to have a well-defined strategy, strong risk management, and the discipline to stick to your plan.
Key points to remember:
- Identify clear, reliable ranges based on historical support and resistance levels, using tools like horizontal lines, moving averages, and Fibonacci levels.
- Look for confirmation from price action and indicators before entering a trade. Avoid chasing entries or trading on hope.
- Always use stop losses to manage risk. Place your stop at a level that invalidates your trade idea, and don’t move it unless you have a clear, pre-defined reason.
- Consider taking partial profits at key levels within the range. This can help to lock in profits while letting a portion of the trade continue to run.
- Be prepared to adapt to changing market conditions. Regularly review your trades and adjust your strategy as needed.
- Manage your risk on every trade. Use appropriate position sizing and never risk more than you can afford to lose.
- Keep a trading journal to record and review your trades. Use it to identify mistakes, refine your strategy, and track your progress.
As with any trading strategy, it’s important to test range trading and find the specific approach that works best for you. Practice in a demo account, start with small position sizes and gradually scale up as you gain confidence.

