- March 16, 2024
- Posted by: Shane Daly
- Categories: Trading Article, Trading Indicators

“The key to trading success is to become an expert in reading the chart, not listening to other opinions.”
– Jesse Livermore, legendary trader. And trendlines provide the purest distillation of the chart.

Trend lines are one of the most common technical analysis tools used by traders. They connect either the highs or lows on a price chart to show the prevailing direction that a security is moving. There are two main types of trendlines – ascending and descending.
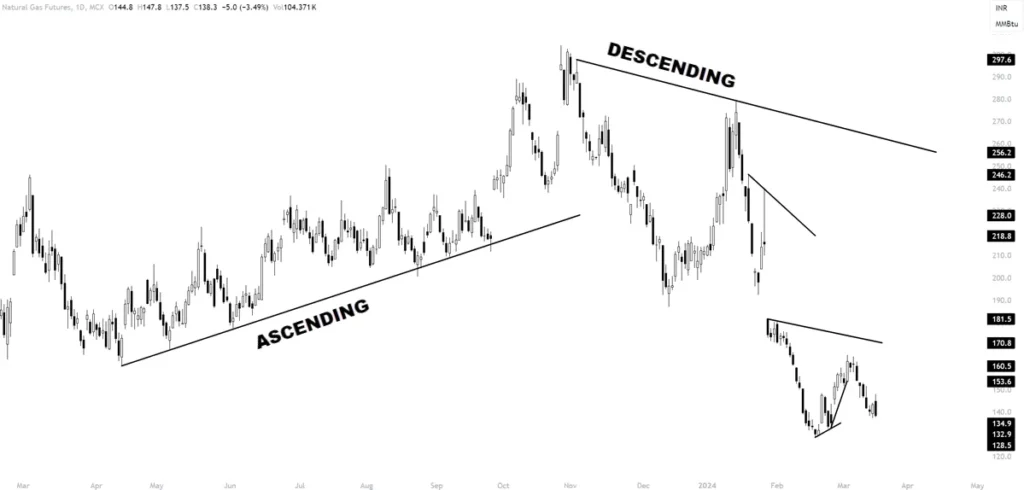 Ascending trendlines connect two or more lows and show rising support levels over time.
Descending trendlines connect two or more highs and indicate falling resistance.
Traders use several strategies using trend lines to capitalize on opportunities in the market:
- Trading pullbacks to ascending/descending trendlines – This involves looking for temporary retracements in the trend where the price pulls back to test the validity of the trendline as support or resistance. Buying pullbacks to an ascending trendline or selling bounces into a descending trendline can offer good risk/reward setups with pre-defined stop loss levels below or above the trendline.
- Breakouts from ascending/descending trendlines – A break and close above or below a trendline signals that the prior trend may be changing direction. Traders will often trade the breakout with a stop loss order placed back below or above the breached trendline.
- Using multiple touches to validate trendlines – Having more than two touching points adds greater weight and validity to a trendline. The more times a trendline is tested, the more significant it becomes on the chart, especially on higher time frames like the daily or weekly charts.
- Choosing appropriate timeframes – While trendlines can be drawn on any timeframe chart, using higher timeframes like the 4-hour, daily, or weekly charts ensures the trendline has more historical price action respecting it. Trendlines often act as stronger support/resistance levels on higher time frames.
Drawing accurate trendlines and combining them with other indicators can lead to high-probability setups. Mastering even basic trendline strategies takes practice but is a must for any technical trader.
Advanced Trend Line Tactics
While basic trendline analysis is useful, more advanced traders employ several tactics to improve the accuracy of their trendline trading.
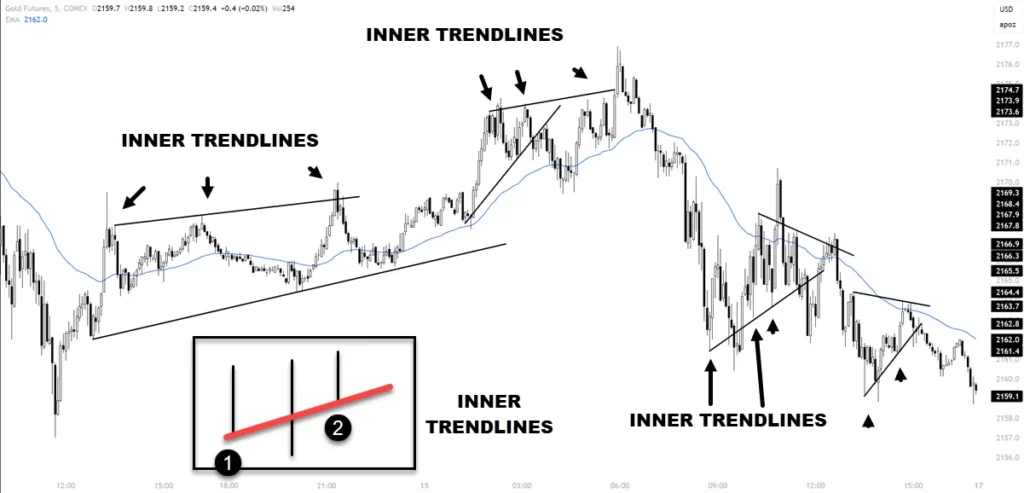 Some of these include:
- Drawing accurate trendlines using swing highs/lows – Basing trendlines off the swing points rather than absolute highs/lows helps filter out market noise. Connecting major swing highs and lows creates more significant trendlines that price respects.
- Trading false breakouts of trendlines – Sometimes price will temporarily spike above or below a trendline before reversing course back within the trend. This “fakeout” offers savvy traders a chance to join the original trend at an advantageous price after the false breakout quickly fails.
- Using trendline breaks to identify trend reversals – Since trendlines reflect the current trend in force, a definitive break and close below/above alerts traders that the prior trend may be ending. Combining other indicators with trendline breaks helps confirm whether a new trend is starting.
- Combining trendlines with indicators like moving averages – Trendlines work best when used with other technical analysis tools like the 50-day and 200-day moving averages. Since moving averages also define the trend, looking for trendline breaks combined with moving average crosses gives high-probability trading signals.
Learning to properly draw and interpret trendlines, spot false breakouts, identify trend reversals early, and use other indicators to confirm creates a robust trading approach. Mastering advanced trend line tactics takes dedication but doing so can significantly improve trading performance.
Trend Line Trading Strategy
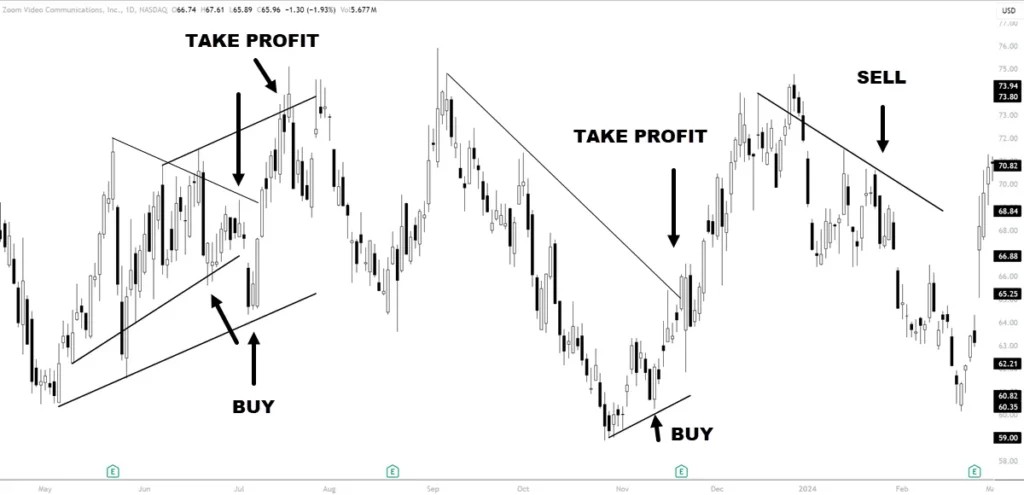
Here is a very simple approach to taking advantage of trendlines:
- Timeframe: Daily chart
- Draw accurate trend lines connecting at least 2 swing highs or lows
- Entry: Buy pullbacks to uptrend line support, sell bounces to downtrend line resistance
- Stop Loss: Below recent swing low for longs, above swing high for shorts
- Target: 1:2 risk-to-reward ratio minimum
- Trail Stops: Below each new swing high in an uptrend, above each swing low in a downtrend
- Manage Positions: Book partial profits at round numbers, exit remaining shares if the trendline breaks
- Confirmation: Wait for the bullish/bearish reversal candle at the trendline before entering
- Indicators: Combine with oscillators, volume, and moving averages for added confirmation
The key advantages are trading with the trend, obvious areas for your stop loss and taking profit, and simplicity. The main limitation is the potential for false breakouts. Always use good risk management when using any trading strategy.
Optimizing Trend Line Trading
To achieve the best results trading with trendlines, traders can learn to distinguish between high-probability and questionable trendline levels.
Some optimization tips include:
Determining strong vs weak trendlines – Strong trendlines connect at least 3 pivot highs or lows and have multiple price touches/tests. Weaker trendlines connect only 2 points and lack additional confirmation. Strong trendlines also align closely with moving averages and high-volume bars at turning points.
Scaling in to ride extended trends – When trading in the direction of a strong trendline, traders can scale in to take advantage of continued momentum. This involves adding to the original position as the trend extends over weeks or months. Setting partial profit targets allows scaling out as the trend matures.
Managing risk with stop losses under key levels – Always using stop loss orders is important when trendline trading. Placing initial stops below key swing lows or minor trendline breaks allows you to limit the downside. Stop levels can be trailed higher to lock in open profits as the trend gains steam.
Getting the highest reward from trendline trading requires analyzing how strongly the price respects the trendlines, adding to winning positions and actively managing risk using stop losses. Refining these aspects takes time but it is worth the time and effort it takes to master them.
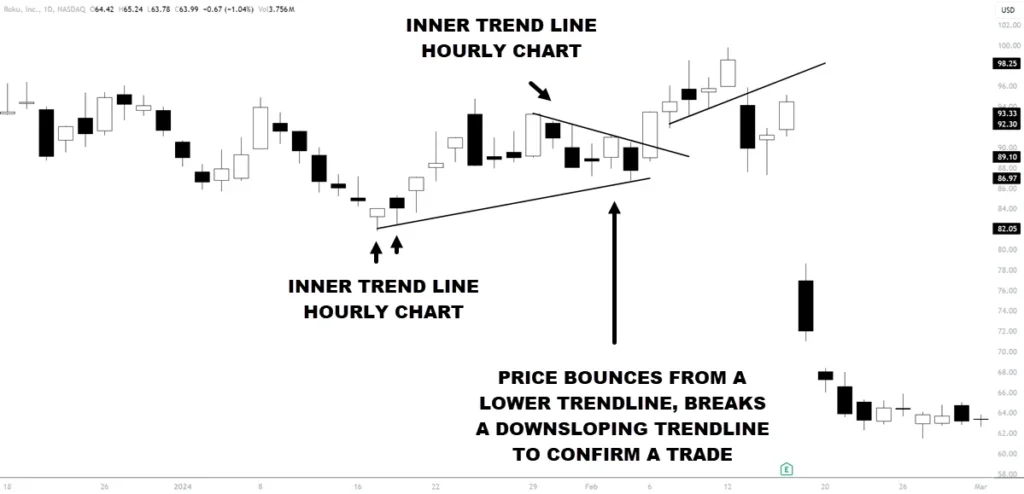
Keep in mind that on higher time frame charts, you may only get to connect 3 points after the price has had a large run up. You can dial down to a lower time frame, draw your trend lines and then go back to the higher time frame chart.
Beyond Simple Trendlines
While basic ascending and descending trendlines are useful, more advanced techniques take trendline trading further:
Channels
Channels are created by drawing parallel trendlines that connect the swing highs and lows of a trending price. Channels clearly define both support AND resistance levels that contain price action. Channels are also a great way to see when the rhythm of the instrument has changed. Breaks out of the channel can point to extended price action which may lead to a mean reversion trade.
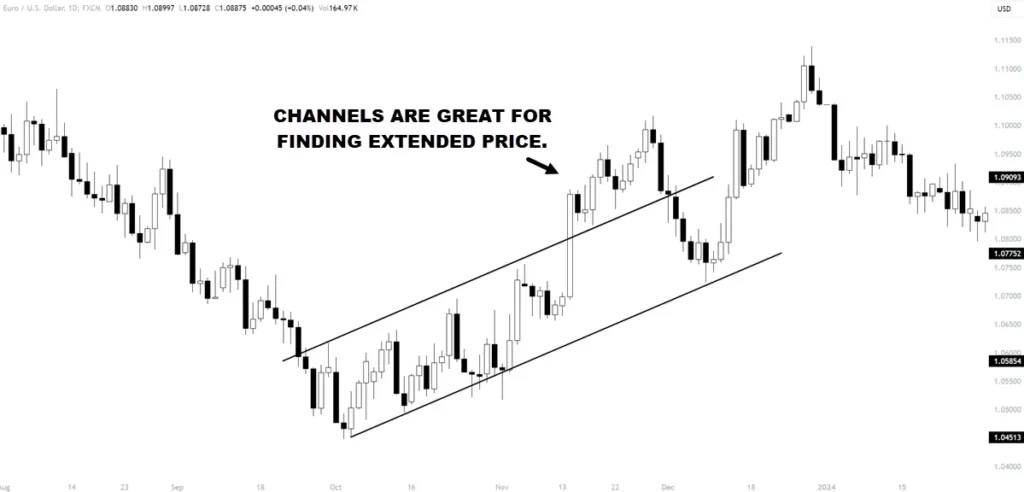
- Trading within rising/falling channels – Buys dips from the lower channel line and selling rallies into the upper channel line allows playing rebounds in both directions within the channel.
- Entries when price touches channel support/resistance – Since channels indicate equilibrium, the upper and lower channel lines often produce buying or selling opportunities when touched. Planning entries at channel barriers provides defined risk points.
Internal Trend Lines
We covered internal trendlines earlier and you may want to include these in your standard trading practice.
- Drawing internal lines to catch corrections – Minor pullbacks within a trend will often find support or resistance from internal trendlines. These lines catch counter-trend moves.
- Entries based on bounces from internal lines – When the price reverses off internal trendline support/resistance, it signals the bigger trend is resuming. This produces advantageous trade entry points in the direction of the major trend.
Mastering analysis of rising/falling channels and internal trendlines provides more precision in timing entries and managing risk. Traders skilled in combining basic and more advanced trendline techniques can boost their performance.
Summary
Mastering even basic trendline strategies delivers an edge while learning more advanced tactics and optimizations furthers profitability. From confirming the strength of trends to timing entries and exits, trendlines provide clarity on the chart.
While simple to draw, trendlines represent a versatile tool applicable to any time horizon or asset class. By combining trendline techniques with other indicators, traders can find confluence that may lead to high-probability setups.
FAQ
Is trendline trading profitable?
Trendline trading can be profitable if done correctly. Trendlines are a fundamental tool in technical analysis used to identify and anticipate the general pattern of price trends. They represent a visual depiction of support and resistance levels in any time frame, providing a clear visual representation of market behavior that can help traders make informed decisions.
What is the best trend line for trading?
The best trend line for trading depends on the direction of the market trend. An uptrend line has a positive slope and is formed by connecting two or more low points, acting as support and indicating that net demand is increasing even as the price rises. A downtrend line has a negative slope formed by connecting two or more high points, acting as resistance and indicating that net supply is increasing even as the price declines.
What is the trend line rule?
The trend line rule is that an uptrend line is considered valid only if it connects at least three low points, and a downtrend line is considered valid only if it connects at least three high points. Additionally, the second low (for an uptrend line) or the second high (for a downtrend line) must be higher (for an uptrend line) or lower (for a downtrend line) than the first, respectively. These rules help ensure the validity and reliability of the trend line although I suggest using lower time frame charts when looking for more than 2 bounces.
What is the best time frame for trendlines?
The best time frame for trendlines depends on the trader’s time frame and strategy. Short-term traders may prefer charts based on interval periods, such as 1 minute, while longer-term traders may use price charts based on hourly, daily, weekly, and monthly interval periods. Time periods can also be viewed in terms of years.
How do you analyze a trend line?
To analyze a trend line, traders should look for the number of touchpoints, the angle of the line, and the behavior of price near the trend line. A trend line with multiple touchpoints is considered more powerful, and the angle of the line can provide insights into the strength of the trend. Price behavior near the trend line, such as bouncing off the line or breaking through it, can indicate changes in market sentiment and potential trading opportunities.

