
- September 3, 2024
- Posted by: Shane Daly
- Category: Trading Article

You’ve likely seen the double bottom chart pattern if you’re familiar with technical analysis. This W-shaped formation can be a powerful tool for identifying potential trend reversals in a downtrend. As a trader or investor, understanding how to spot and interpret this pattern correctly can give you a significant edge in your decision-making process.
But what makes a double bottom reliable, and how can you avoid common mistakes when trading based on this pattern?
This new report shows you exactly how to trade breakouts. It’s a strategy used by professional traders to rack up winning trade after winning trade. Don’t get left behind – learn about this price action trading strategy today… Download Your Free “Breakout Trading Plan” report NOW!
Understanding the Double Bottom Chart Pattern
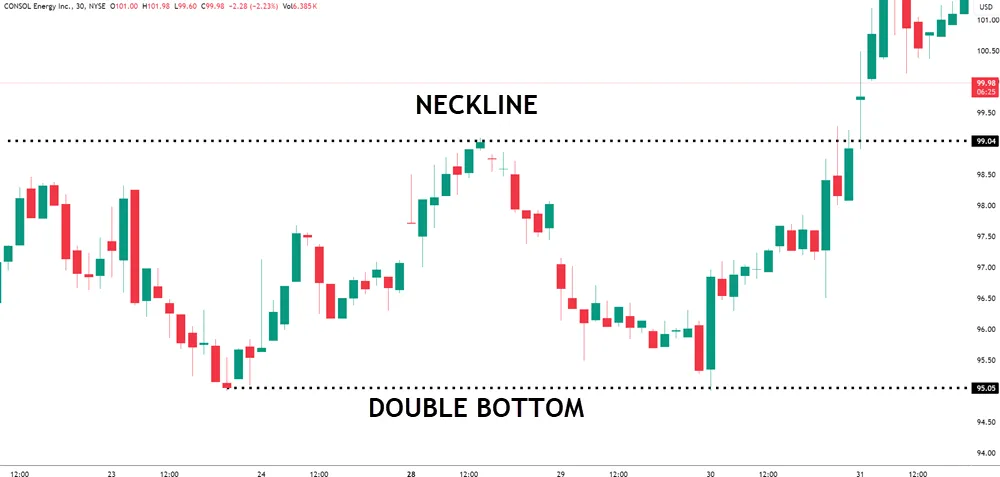
The double-bottom chart pattern, characterized by two distinct lows at approximately the same price level, typically emerges after a downtrend and is considered a bullish reversal indicator.
The double bottom consists of three key components:
- Two bottoms at similar price levels
- A moderate price rise between the lows
- A neckline acting as resistance
Understanding this pattern is important for effective risk management and trend analysis as you develop your trading strategies.
Volume Analysis
Volume analysis plays a significant role in confirming a double-bottom pattern. During the formation of the first low, trading volume typically decreases, indicating a lack of selling pressure.
As the price approaches the second low, a decrease in volume suggests that selling pressure is waning, setting the stage for a potential reversal.
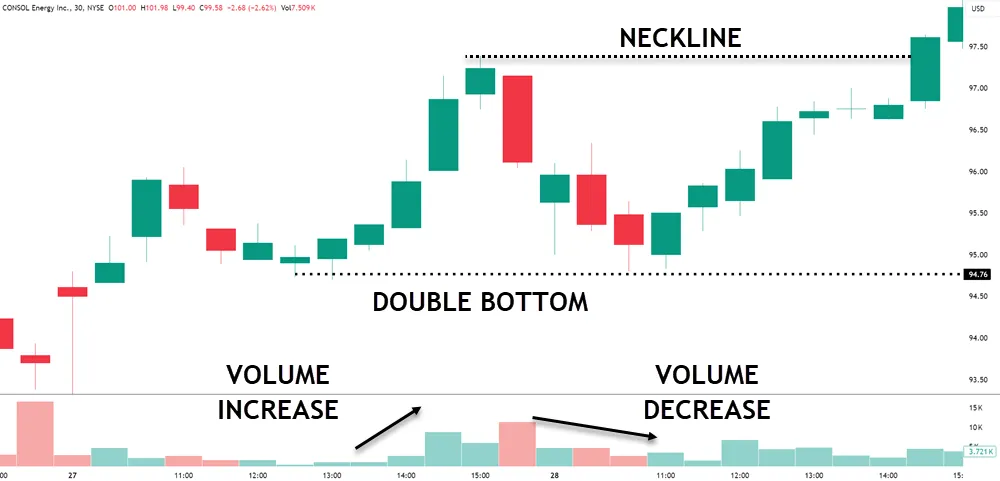
The real confirmation comes when the price breaks above the neckline, often accompanied by a significant volume spike, validating the pattern’s completion.
To effectively use volume analysis in your trend analysis:
- Monitor volume during the formation of both lows
- Compare volume levels at key price points
- Look for volume spikes at breakouts
Timeframe Considerations
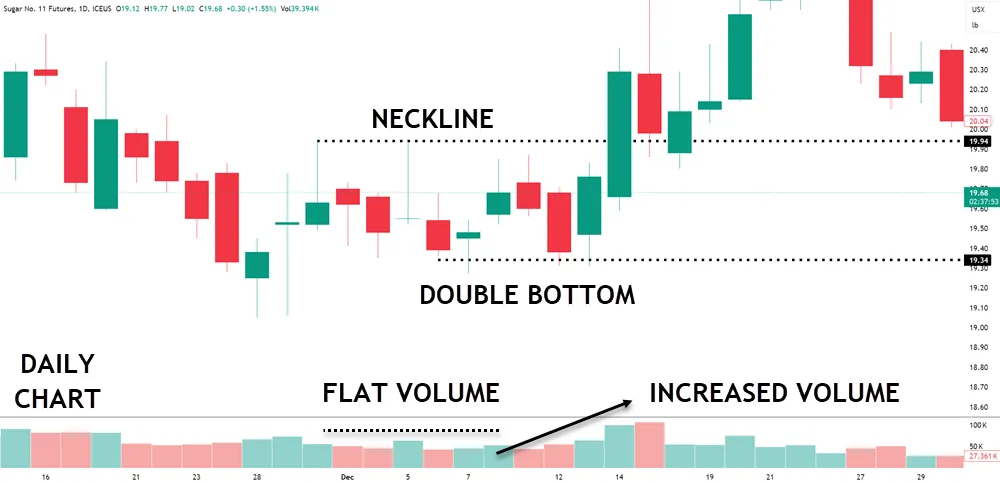
To effectively identify and trade this pattern, focus on daily or weekly charts, as these provide the best visibility for long-term trends. Longer timeframes allow you to filter out short-term market volatility, leading to more confident and well-reasoned trading decisions.
When examining double-bottom patterns on daily or weekly charts, pay attention to:
- The depth and duration of each bottom
- The volume patterns during the formation
- The height of the neckline relative to the bottoms
- Any potential divergences in technical indicators
Incorporate this pattern into your technical analysis toolkit, and remember that while generally reliable, no pattern is perfect. Always maintain a disciplined approach to risk management when implementing trading strategies based on the double-bottom chart pattern.
Double Bottom’s Indication Of Market Sentiment
When you observe this formation on a chart, you’re witnessing a significant transformation in trader psychology. As the price reaches its first low, selling pressure diminishes, indicating that bears are losing their grip on the market.
This loss of downward momentum is important for sentiment analysis, as it suggests the potential for a market reversal.
As the pattern develops, you’ll notice increased buying pressure at the second low. This surge in bullish activity reflects growing optimism among traders, who are now more willing to enter long positions. The neckline break, often accompanied by higher volume, confirms the shift towards a bullish outlook.
Key indicators of sentiment change:
- Decreasing selling pressure
- Rising buying interest
- Breakout above neckline
- Increased trading volume
It’s important to note that the effectiveness of a double bottom is improved when supported by positive market fundamentals.
Reliability Of Double Bottoms As Bullish Signals
The reliability of the double bottom pattern as a bullish reversal signal is generally considered high among experienced traders and technical analysts. This chart pattern’s effectiveness comes from its ability to capture market psychology observations and indicate a potential shift in trend.
When using any bullish reversal strategies, you’ll find the double bottom pattern to be a valuable tool in your toolbox.
To maximize the pattern’s reliability, consider these key factors:
| Aspect | Details |
|---|---|
| Trading Volume Significance | Look for increased volume on the second bottom and during the breakout. |
| Pattern Formation | Ensure the two bottoms are at similar price levels and separated by a clear peak. |
| Confirmation | Wait for a breakout above the peak between the two bottoms before entering a trade. |
Implementing proper risk management techniques is important when trading this pattern. Set stop-loss orders below the second bottom and consider using a risk-reward ratio of at least 1:2.
Price Targets Following Double Bottom Breakouts
Traders typically use a few common methods to estimate potential upside when they’re considering price targets after a double-bottom breakout. One of the most popular price target strategies measures the breakout distance from the neckline to the pattern’s bottom and projects it upward from the breakout point.

This technique provides a conservative estimate for potential gains.
Another approach for setting profit levels is to use Fibonacci extensions, which can help identify key resistance levels where the price may pause or reverse. You’ll want to consider multiple timeframes when applying these extensions to improve your analysis.
It’s important to incorporate risk management techniques when determining price targets. You should adjust your targets based on market volatility impact, as highly volatile markets may require wider profit targets to account for increased price swings.
Additionally, consider using trailing stops to protect profits as the price moves in your favor.
Common Mistakes In Double Bottom Interpretation
Double-bottom pattern interpretation pitfalls can trip up even experienced traders. Your trading psychology plays an important role in avoiding these common mistakes, which can lead to significant losses or missed opportunities.
| Error Type | Description |
|---|---|
| Premature Identification | Assuming a double bottom has formed before it’s fully confirmed. This enthusiasm can lead to entering trades too early, before the price breaks above the neckline—a critical validation point. (Note: There are price patterns such as springs at the support that may allow for an earlier entry.) |
| Neglecting Volume Analysis | Low volume can indicate weak market participation, potentially undermining the pattern’s reliability. |
To improve your pattern recognition skills and manage risk effectively, consider these key points:
- Set realistic profit targets based on the measured move from the neckline to the lows.
- Always use stop-loss orders to protect against adverse price movements.
- Seek confirmation from additional technical indicators like moving averages or RSI.
Frequently Asked Questions
Can a Double Bottom Pattern Form on Different Timeframes?
Yes, you’ll find double bottom patterns across various timeframes. They’re significant for trend reversal analysis. When identifying them, consider volume analysis, psychological factors, and support levels. Remember, the pattern’s reliability can vary depending on the timeframe.
How Long Does It Typically Take for a Double Bottom to Complete?
You’ll find the completion timeframe varies based on market conditions and trading volume. It could take days or weeks. Focus on price targets and risk management instead of fixating on time. Always adapt your strategy accordingly.
Are There Any Specific Sectors Where Double Bottoms Are More Common?
You’ll find double bottoms across various sectors, but they’re more common in cyclical industries. Conduct sector analysis to spot market trends. Consider tech and consumer discretionary stocks as examples. Integrate this pattern into your trading strategies, but remember pattern reliability varies.
Can Double Bottom Patterns Be Used in Conjunction With Other Technical Indicators?
You can combine double-bottom patterns with other indicators. Consider using volume confirmation signals, market trend analysis, and risk management strategies. They’ll help you identify better entry points and understand chart pattern psychology for more informed trading decisions.
What’s the Difference Between a Double Bottom and a Triple Bottom Pattern?
You’ll find that triple bottoms have three troughs, while double bottoms have two. Both patterns reflect market psychology, but triple bottoms can indicate stronger support. When interpreting charts, consider these patterns alongside volatility and risk management in your trading strategies.
Conclusion
The double-bottom chart pattern is a powerful tool in your technical analysis toolbox. Remember, while it’s a reliable bullish reversal indicator, it’s not perfect. Always confirm the pattern with volume, neckline breakout, and other technical indicators.
By understanding its key characteristics, implications, and potential pitfalls, you’ll be better equipped to identify and trade this formation. As with any trading strategy, practice, patience, and risk management are important for success.