- October 5, 2023
- Posted by: Shane Daly
- Categories: Swing Trading, Trading Article

Trading on the daily time frame is most effectively executed through the use of trend-following strategies. For daily time frame trading, the recommended strategies include the role reversal setup (trend change) and the breakout pullback setup. To implement these strategies, first, identify key support levels in bearish trends and resistance levels in bullish trends on the daily chart.
Then, await a breakout and subsequent pullback to the identified level before initiating a trade.
The daily time frame is best for trend-following strategies, while the 4-hour chart is suitable for capturing market swings. Daily price action setups require patience and discipline, and key support and resistance levels should be identified. Using candlestick patterns and breakout pullback setups can be effective strategies.
Adapting strategies to market conditions and managing risk are also important.
Analyzing the price action context aids in identifying optimal entry and exit points for daily price action setups while trading across various time frames and provides a comprehensive view for recognizing trends and possible reversals. The daily time frame suits trend-following strategies, and the 4-hour chart is well-suited for capturing significant market swings.
Understanding the Concept of Price Action
Price action trading focuses on analyzing the movement of prices on a chart and interpreting market sentiment. It relies on understanding the behavior of buyers and sellers in the market.
 One aspect of price action trading is identifying daily price action setups. These setups are based on the analysis of candlestick patterns, which provides clues to who is in control – buyers or sellers. By studying the patterns formed by the open, high, low, and close of each candle, traders can gain an understanding of market sentiment and the potential for price reversals.
Understanding the concept of price action is crucial for successful trading, as it allows traders to make informed decisions based on real-time market data.
Impact of Time Frames on Price Action
When considering the impact of time frames on price movement, it’s never a bad idea to analyze different perspectives and trends. The choice of time frame can significantly affect the outcome of price action setups.
 For example, daily price action setups provide a longer-term perspective on the market. These setups are suitable for trend-following strategies and can be identified by analyzing the overall price action context and trend on the daily chart.
Lower time frames such as the 4-hour chart allow for capturing larger market swings and are suitable for swing trading. Swing trading is a trader looking to capture one true swing in the market and exit prior to reversal. It is not dependent on the length of holding the trade.
Daily Time Frame: Analysis and Strategies
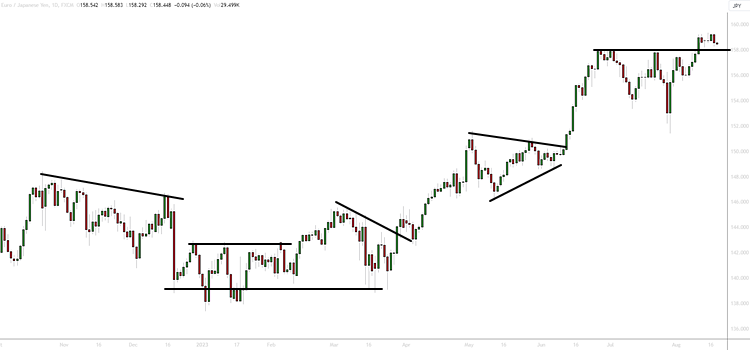
To analyze the daily time frame, it’s important to identify key levels of support and resistance for setups.
These setups can provide valuable opportunities for traders to enter and exit positions. When analyzing the daily time frame, traders should look for price patterns, candlestick formations, and trendlines that indicate potential reversals or continuation of the trend. By identifying these setups, traders can develop strategies that align with the current market conditions and the risk tolerance of the trader.
 It’s important to note that daily price action setups require patience and discipline, as they may take longer to develop compared to lower time frames. Proper risk management and strict adherence to the trading plan are essential for success in daily chart trading strategies.
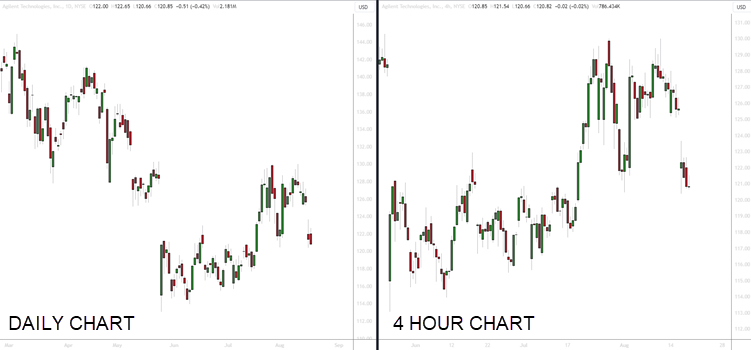
Making Sense of Price Action on the 4-Hour Chart
Understanding price action on the 4-hour chart can provide opportunities for a swing trade. By analyzing the movement of price in this timeframe, you can gain a better understanding of daily chart trends and identify potential trading opportunities.
 Here are three key aspects to consider when trading price action on the 4-hour chart:
- Daily Chart Trends: Start by identifying the overall trend on the daily chart. This will give you a broader perspective of the market and help you determine whether to focus on long or short trades.
- Daily Price Action Breakout Strategies: Look for breakout opportunities on the 4-hour chart that align with the daily chart trend. A breakout occurs when the price moves above or below a key level of support or resistance. This can signal a potential trend continuation or reversal.
- Identifying Daily Price Action Trends: Pay attention to the price action patterns and candlestick formations on the 4-hour chart. These can provide valuable insights into the current market sentiment and help you make informed trading decisions.
Insights Into Price Action Trading Techniques
When it comes to daily price action setups, there are a few trading techniques that can be effective. One of these techniques is using candlestick patterns for daily trading. Candlestick patterns, such as engulfing patterns, doji patterns, and hammer patterns, can provide important signals for potential trade setups. These patterns can indicate reversals or continuations in price movement.
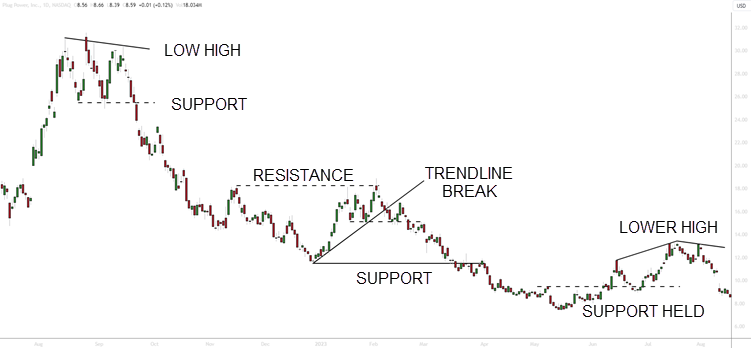
Understanding key support and resistance levels on the daily chart can help you identify potential entry and exit points. Price can stall at these price zones and could be a good time to either find an entry or exit your current trade.
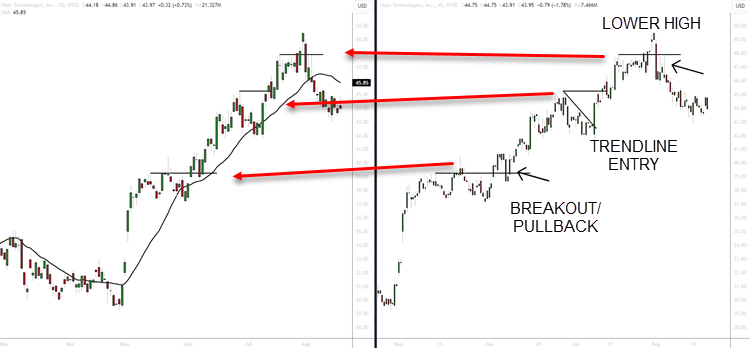
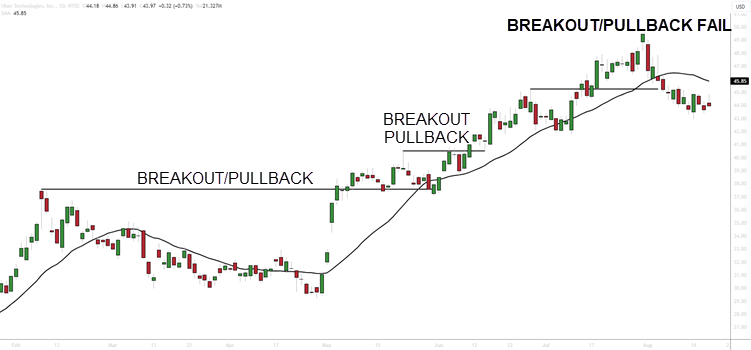
Breakout Pullback Setup
When exploring the breakout pullback setup, it’s important to identify key levels of support and resistance. These are obvious areas for traders to monitor for potential trades.
 Here are three crucial aspects to consider when utilizing this strategy:
- Daily Price Action Setups: Analyze the daily chart for potential trade setups. Look for patterns, such as breakouts and pullbacks, that indicate a shift in market momentum. These setups can provide excellent trading opportunities.
- Four-Hour Swing Trading Setups: Use the four-hour chart to identify swing trading setups. Swing trading involves capturing shorter-term market swings within the context of the overall trend. Look for breakouts and pullbacks on the daily chart to enter trades with favorable risk-reward ratios.
- Daily Candlestick Analysis: Pay attention to candlestick patterns on the daily chart. Candlestick analysis can provide insights into market sentiment and potential reversals. Look for bullish or bearish candlestick patterns that align with the breakout pullback setup.
Tips for Successful Price Action Trading
If you want to be successful in price action trading, it’s important to understand the behavior of buyers and sellers in the market.
Here are three tips for successful daily price action setups:
- Utilize daily chart pattern recognition to identify key support and resistance levels. This will help you determine potential entry and exit points for your trades.
- Trade daily volatility with price action by looking for strong price movements indicating momentum. This can be done by monitoring price patterns and breakouts on the daily chart.
- Incorporate daily chart analysis into your trading strategy. By understanding the overall trend and market sentiment on a daily timeframe, you can make better trading decisions.
Adapting Price Action Strategies to Market Conditions
Adapting price action strategies to market conditions is crucial for successful trading. Markets such as range-bound markets are not good for trading pullbacks and as a trader, you need to know the difference.
- Stay flexible: Market conditions can change rapidly, so it’s important to be flexible. Keep an eye on key indicators and news events that may impact the market. Adjust your trading strategy accordingly to take advantage of opportunities as they arise.
- Use different setups: The daily time frame offers a variety of price action setups that can be used in different market conditions. Whether it’s a trend continuation setup, a reversal setup, or a breakout setup, having a diverse set of strategies will allow you to adapt to different market scenarios.
- Monitor volatility: Market conditions can vary in terms of volatility. During high volatility periods, price action setups may occur more frequently, while during low volatility periods, setups may be less common. Monitor volatility levels and adjust your trading approach accordingly.
Frequently Asked Questions
What Are Some Common Candlestick Patterns Used in Price Action Trading?
Some common candlestick patterns used in price action trading include the doji, engulfing pattern, hammer, and shooting star. The doji indicates indecision in the market, while the engulfing pattern signals a potential reversal. The hammer and shooting star indicate a potential change in trend.
How Do You Determine Key Support and Resistance Levels in Price Action Trading?
To determine key support and resistance levels in price action trading, analyze the price movements on the chart. Look for areas where the price has repeatedly reversed or stalled, indicating strong levels of support or resistance. These levels can be identified using horizontal lines or trendlines. Focus on significant swing highs and lows, as well as areas where the price has consolidated or formed patterns such as bull and bear flags.
What Are Some Indicators That Can Be Used During Price Action Analysis?
Some indicators that can complement price action include moving averages, trendlines, Keltner Channels, and Fibonacci retracement levels. Moving averages can help identify the overall trend, while trendlines provide support and resistance levels. Fibonacci retracement levels can indicate potential reversal areas. Using Keltner Channels helps determine instruments that are stretched too far from an average price.
How Do You Manage Risk in Price Action Trading?
To manage risk in price action trading, always use proper position sizing to ensure you’re not risking too much on any single trade. Consider placing stop-loss orders to limit potential losses. It’s also important to regularly review and adjust your risk management plan based on market conditions.
What Are Some Common Mistakes to Avoid in Price Action Trading?
Some common mistakes to avoid in price action trading include:
- Not establishing the price action context before making trading decisions.
- Neglecting to use multiple time frames for analysis.
- Failing to practice proper risk management.
It’s important to avoid:
- Chasing trades and entering positions without a clear setup.
- Emotional trading, such as revenge trading or overtrading, can lead to poor decision-making.
To avoid these mistakes, it’s essential to:
- Develop a solid trading plan.
- Stick to the plan.
- Continuously learn and adapt.
Conclusion
Understanding price action and using different time frames are crucial for profitable trading in a bear market. Analyzing the daily time frame allows traders to identify trends and potential reversals. This information is valuable for making informed trading decisions.
The 4-hour chart is more suitable for capturing larger market swings.
There are specific strategies that traders can use to enhance their trading performance. The reversal setup and breakout pullback setup are two examples. These strategies provide a framework for identifying potential entry and exit points.
It is important to continuously practice and gain experience. Market conditions are constantly changing, so traders must be willing to adapt their strategies when needed.