- November 15, 2021
- Posted by: Shane Daly
- Category: Trading Article

The bullish engulfing candlestick pattern is a two candlestick reversal pattern that is looked for during a down trending market.
In a perfect world, the bullish pattern is found at the bottom of a down trend and leads to an uptrend in the instrument.
You can also look for it during the corrective phase of an uptrend (pullbacks) as you look for price to resume upwards.
What Does The Bullish Engulfing Pattern Look Like?
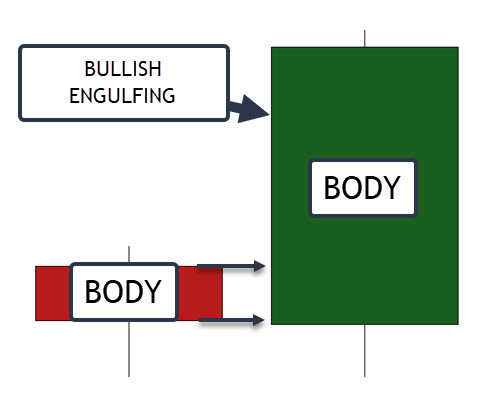
The key features for a bullish engulfing include:
- First candle should close lower than its open making it red – a bearish candle
- The second candles real body must take out both the open and close of the first candle – a bullish candle
- The lower or upper shadow does not have to be taken out to be a valid reversal candle. If they both are, we will see an outside bar form.
- Traders are looking for a complete trend reversal
What we are seeing with the bullish engulfing candle.
The first candle closing red shows that sellers were in control during that period.
The following day, price can open lower however it must then take out the entire body of day one.
When this occurs, the sellers that were involved previously, are seeing a strong move against their position. The imbalance of buyers/sellers is fairly strong as buyers push price over the previous open price.
Shorts, seeing their position under water from the previous day, will tend to begin to exit if they don’t see a reversal back to the downside.
We have seen a strong change in sentiment especially if the engulfing candle closes at or near its high.
Time Frame Matters With Candlestick Patterns
One thing to keep in mind is the bullish engulfing may not be the same on a lower time frame or a higher time frame.
The first chart was a one hour chart.
This chart is a two hour chart.
Our original pattern has disappeared but now we have another type of candlestick we can trade. – an inside bar.

What you would have seen was an inside bar that breaks to the upside. Still a trade but if you were looking to trade only engulfing candles, you’d have to piece it together.
It is also a correction on another time frame.
I have spoken about trading multiple time frames but also having the ability to understand what your current chart is telling you.
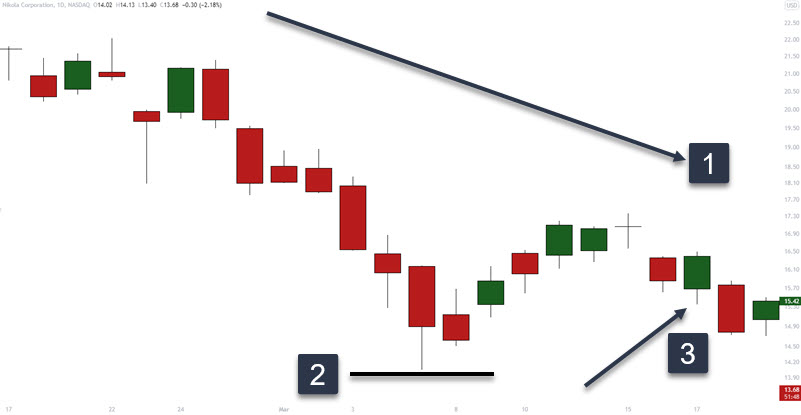
This is a daily chart of the stock NKLA
- Price has put in lower highs and lows which is a down trend
- The last low and a normal corrective rally
- A legitimate bullish engulfing pattern that could be the beginning of a higher low and a reversal from down to uptrend
Time frames will have their own structure and what looks like a reversal after a gap down is a rally on a lower time frame.
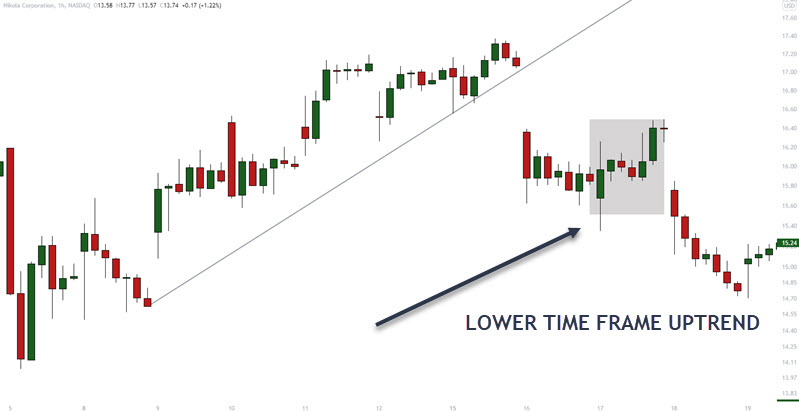
Traders on the lower time frame are actually trading an uptrend. On this day, an outside bar starts up the rally in price but then is wiped out the next day.
I personally trade the daily chart and will glance at the lower time frames. I find it fits my personality. Day traders at Netpicks are fans of our High Velocity Wave Trader for active day trading for income.
The important point is that a green candle that completes the engulfing pattern may not be an important development on the chart. This is why having a set method of approaching them is important.
Trading The Bullish Engulfing Pattern
In trading, context matters, and one of the first things we need to know is the trend direction.
We can trade this pattern in an uptrend, downtrend, and in a trading range but the approach is a little different.
Let’s look at price in a downtrend but on a lower time frame.
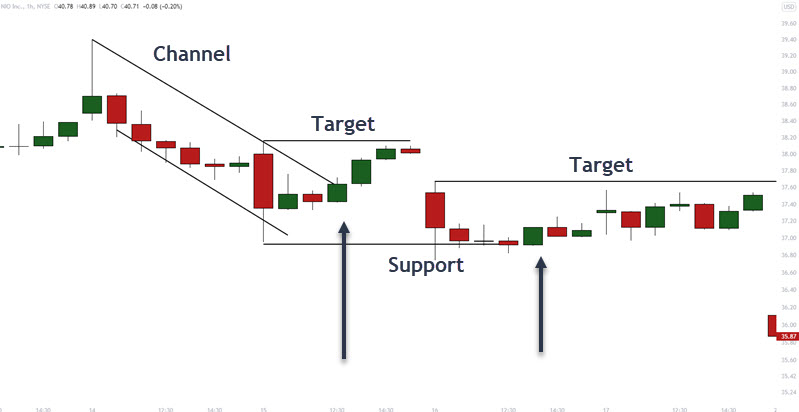
The black arrows are the engulfing pattern. If day trading, you would want to find an area where we can expect a bounce in price. These are counter trend trades.
In this example, we are using channels and a price support level as potential bounce zones. Traders may also consider moving averages however they are not true support/resistance.
Targets on these trades would be small and here we are looking at obvious price levels. The candle highs that we are targeting here stand out in a sea of smaller candles. You could also use a multiple of your risk to take profits so you exit at 1, 2, 3 times your initial risk.
A protective stop loss can go below the low of the engulfing candlestick.
Daily Chart Levels
A daily chart can often give a large bounce or complete trend reversal.
This daily stock chart puts in a triple bottom and sets up a reversal with our pattern.
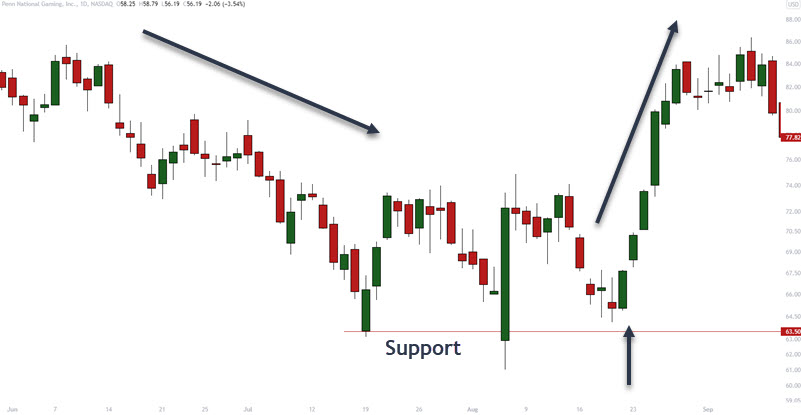
Price ended the current down trend and rallied almost 30% off this support zone.
Although price did put in a higher high, we eventually did see a rollover back downside.
Notice that the first candle in the pattern did try to rally on that day as evident by the upper shadow. Sellers stepped in to drive price down and close red on the day. The next day, with barely any move lower off the opening price, the high of the previous day was taken out.
Corrective decline in an uptrend.
The engulfing pattern would be our price reversal signal back to the upside. Think of it as a trade entry trigger as you play a pullback/reversal.
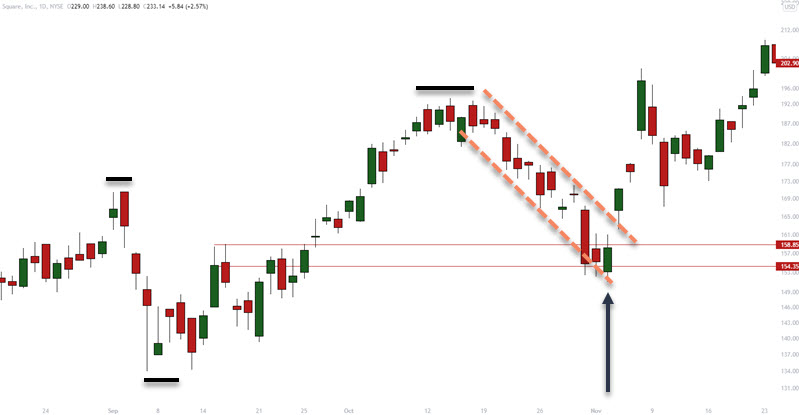
We have price making higher highs and higher lows showing an uptrend.
Price pulls back into a former resistance level as well as to the bottom of a trend channel.
The black arrow is our reversal candle.
Traders can enter near the close of the trading day or upon the opening print of the next day.
On a lower time frame, this would be an obvious move down, a complete down trend, and the bottom of that move would be made.
Trading Range
The same concepts will apply in a trading range.
Traders will look for a bullish reversal off the lows of the trading range for a play to resistance.
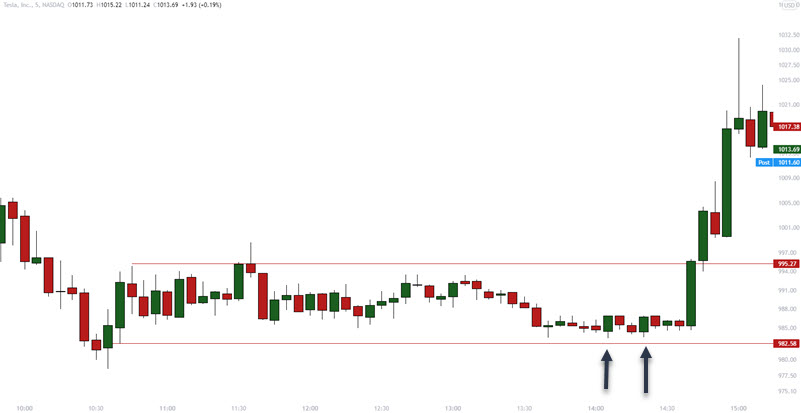
We have defined support and resistance levels and these two reversals happen at the bottom of the range.
This actually positioned a trader prior to a strong breakout of price.
I would not expect this move as a default and would be looking at the top of the range for the extent of the play. This move would be a pleasant surprise and I would be taking risk out of the market quickly with trade management.
Protective Stop Loss
The great feature of this pattern is the obvious imbalance of buyers and sellers.
Remember, sellers took the previous day lower only to see buyers step in and overwhelm them with buying pressure the next period.
If this pattern fails, it will rollover on the next period and usually with a big bearish candle.
A protective stop that respects the meaning of the pattern, is proper.
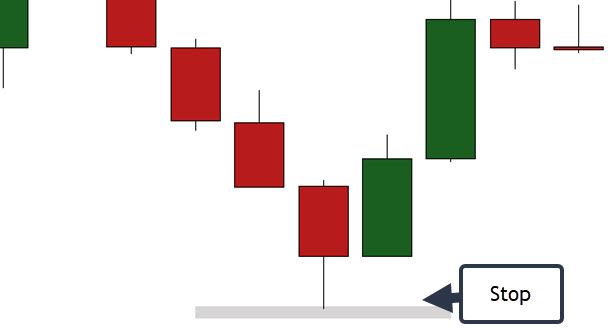
We are going to look to place our stop below the lowest low of the two candles when taking a long position. In this example, it would be under the first candlestick of the sequence. These can often act as support levels when you see this imbalance of buyers and sellers.
Profit Targets
What you set for price targets will depend on what you expect from the trade. We would like to see higher prices over the long term however that will be time frame dependent.
Using resistance zones as targets or multiples of risk, both are a good starting point for taking profits.
The bullish engulfing candle pattern does have the potential to turn into a complete trend reversal and having a trailing stop technique could also be a good idea.
There are no hard and fast rules for profit taking. A lot depends on the trader.
Overall
Candlestick reversal patterns such as this are a viable approach to trading. You do want to add other aspects of technical analysis such as support levels and trend channels. There can be many trading setups at locations that have no meaning. Looking for previous price zones that rejected price and swing pivot areas are a good spot to find this pattern.
Engulfing patterns may also be used as information only. Depending on your own trading strategy, incorporating the meaning behind a well placed pattern into your own method, could lead you to better trades.
Good luck and let me know how it goes.
