- January 9, 2024
- Posted by: Shane Daly
- Category: Trading Article

Pullback trading is a strategy that capitalizes on temporary price declines within an overall uptrend, offering traders an opportunity to enter the market at a more favorable price point. It is important to distinguish these short-term dips from full trend reversals, which signal a significant change in market sentiment and direction. Traders often use methods such as trend line pullback trading, support and resistance zones, and Fibonacci retracement strategies to identify better entry points during a pullback.
 TLDR
TLDR
- Pullbacks are temporary decreases in price during an uptrend.
- Pullbacks should be differentiated from reversals, which indicate a fundamental shift in market sentiment.
- Trend line pullback trading and Fibonacci retracement pullback strategy are common techniques used in pullback trading.
- Entry and exit strategies, as well as risk management techniques, are crucial in successful pullback trading.
Identifying Pullback Opportunities
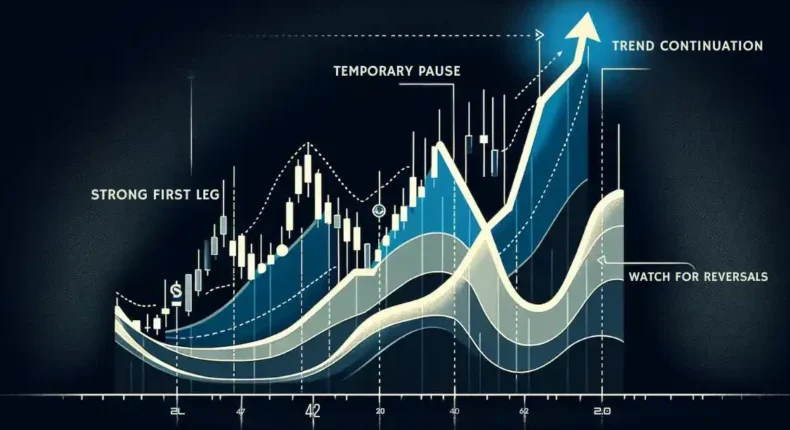
 To pinpoint pullback opportunities, you must first identify a strong, prevailing trend and observe its momentum. Watch the trend waves, looking for those that push significantly past a technical breakout or breakdown level, which often indicates a robust move. These extended moves frequently lead to profitable pullbacks.
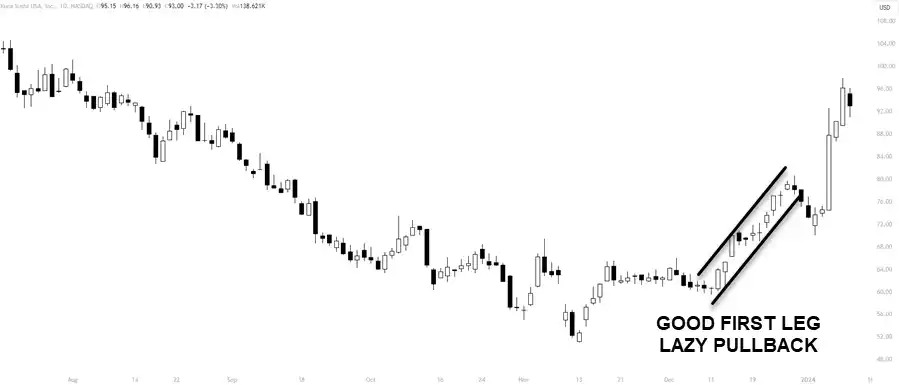
The first leg, the original thrust in price, should be a linear move. While that can be subjective, ask yourself if that move looks like it wants to have a second leg.
As the trend unfolds, trendline validation (as a strategy) takes on a role. You’re looking for securities that respect longer-term trendlines—bouncing off of them rather than breaking through. When a pullback to the trendline occurs, and the price holds, it suggests the trend is intact, signaling a potential entry point.
Your analysis should also include identifying swing highs and lows. A swing low in an uptrend, or a swing high in a downtrend, can act as a launchpad for the next trend wave.
Identifying the Relevant Trend
 To master pullback trades, consistently identifying the trend is essential for successful trading. You need to recognize trend strength and be able to distinguish between swings that have a probability of continuation and those that do not.
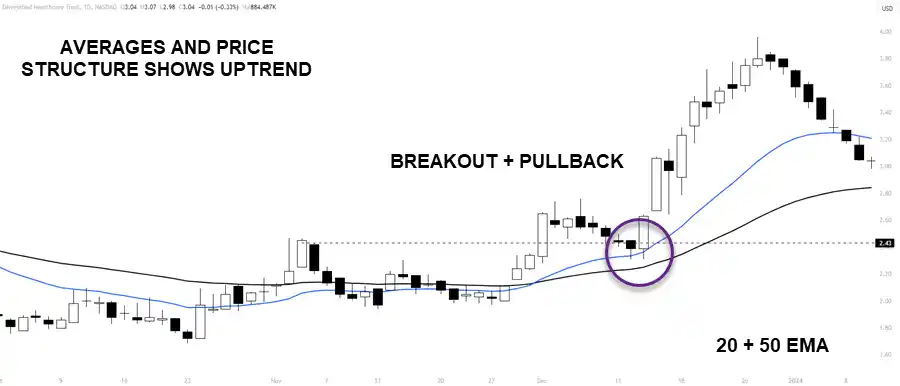
In a strong trend, the price may respect the 20MA and 50 moving averages. You do not need moving averages to determine the trend direction as trend direction can be seen via price movement. Looking for higher highs and lows with strong bullish candles is good enough for an uptrend and the opposite for downtrends.
Identifying your trading zone is also critical. In general, looking for price structure is helpful along with monitoring the price action of the pullback.
Strategies for Trading Pullbacks
Having established how to identify pullback opportunities in a strong trend, let’s look at the strategies that can capitalize on these moments. Pullback trading strategies hinge on good entry points and robust risk management. You’ll want to enter a trade during a pullback once the price holds a level and begins to show signs of a reversal. This increases the likelihood of a successful trade as these levels often attract other market participants’ attention.
Specific Pullback Trading Plan
Objective: To capitalize on temporary price declines within a confirmed uptrend to enter long positions.
 1. Identify the Uptrend:
- Use a combination of higher highs and higher lows on the chart.
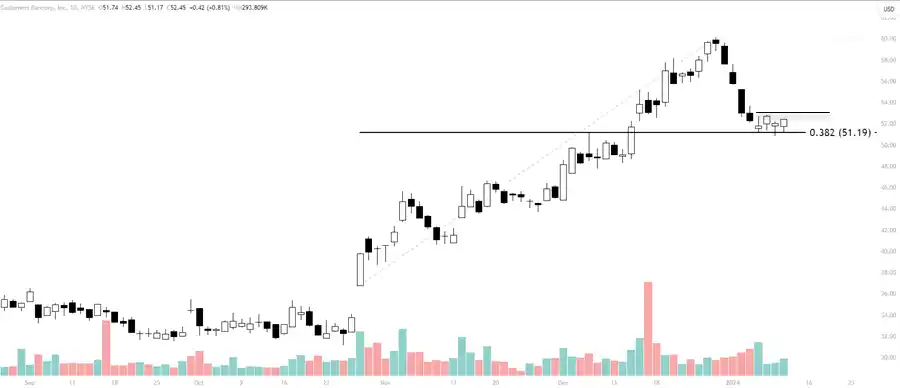
- Confirm with a moving average (e.g., the price is above a rising 20/50-day MA – see last chart).
2. Determine Pullback Zones:
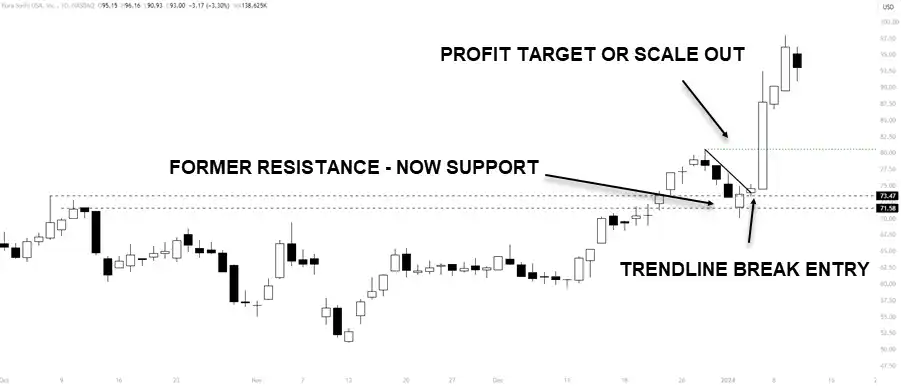
- Mark out previous resistance levels that could turn into support.
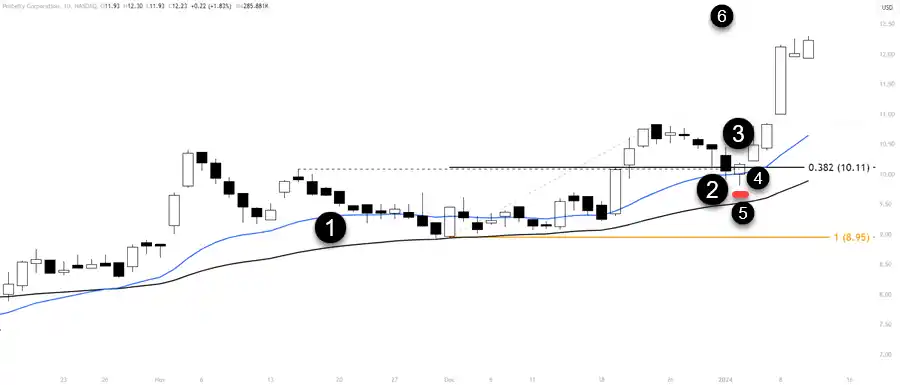
- Use Fibonacci retracement levels from the recent swing low to high to find potential pullback areas (e.g., 38.2%, 50%, 61.8%).
3. Wait for Pullback Confirmation:
- Look for price action to enter the pullback zone with decreasing volume, suggesting a lack of selling pressure.
- Wait for a bullish reversal candlestick pattern (e.g., hammer, engulfing) within the zone.
4. Entry Strategy:
- Enter a long position after a bullish confirmation signal.
- For additional confirmation, wait for a break above a short-term moving average or a trendline drawn across the highs of the pullback.
5. Stop Loss Placement:
- Set a stop loss below the most recent swing low within the pullback zone or below a key Fibonacci level to protect against a reversal.
6. Profit Targets:
- Set initial profit target at the previous high or an all-time high if applicable.
- Consider using a trailing stop loss to capture further gains if the uptrend continues.
7. Risk Management:
- Risk no more than 1-2% of the trading capital on a single trade.
- Adjust position size accordingly based on the distance to the stop loss.
8. Trade Management:
- Monitor the trade for signs of weakness or trend exhaustion.
- Be prepared to exit if the price action suggests a trend reversal, such as breaking below key moving averages or forming lower highs.
9. Review and Adjust:
- Regularly review completed trades to assess performance and refine strategy.
- Stay updated on market conditions that may affect the strength of the uptrend.
This is a systematic approach to trading pullback in an uptrend and you need to add in disciplined execution and risk management.
Entry Strategies for Pullbacks
 When trading pullbacks, it is important to pinpoint entry points where support or resistance levels occur, which can support a successful trade. You’re seeking narrow price zones that signal a high likelihood of a strong reversal.
| Entry Signal | Stop Loss Placement | Profit Target Strategy |
|---|---|---|
| Trendline Break | Below Swing Low | Previous High |
| Moving Average Bounce | ATR-based Distance | Fibonacci Extension |
| Breakout Pattern Confirmation | Below Pattern Low | Fixed Reward: Risk Ratio |
| Volume Spike | Below Recent Support | Trailing Stop Loss |
| RSI Divergence | Below RSI Low Point | Set Percentage Gain |
Entry strategies for pullbacks often involve waiting for price action to confirm these overlap areas as support or resistance. Don’t treat these points as thin lines; instead, see them as bands or zones where prices can stabilize and reverse. If you’re looking at a Fibonacci level, for example, watch for the price to approach a key retracement level, such as 38.2% or 61.8%, and then seek additional confirmation from other technical tools or patterns.
Note: I always suggest when using an indicator to find zones, verify the zone by looking left on the chart for price structure. Do not trade an indicator blindly.
It’s equally important to set a stop loss to manage risk. Ideally, place your stop loss beyond a support or resistance band—not too tight to avoid market noise, and not too loose to keep risk under control.
Consider scaling into a position near conflicting price levels and if looking to trade complete trend reversals. This approach allows you to manage risk incrementally as the pullback occurs, optimizing your entry while maintaining a clear exit strategy.
Setting Profit Targets
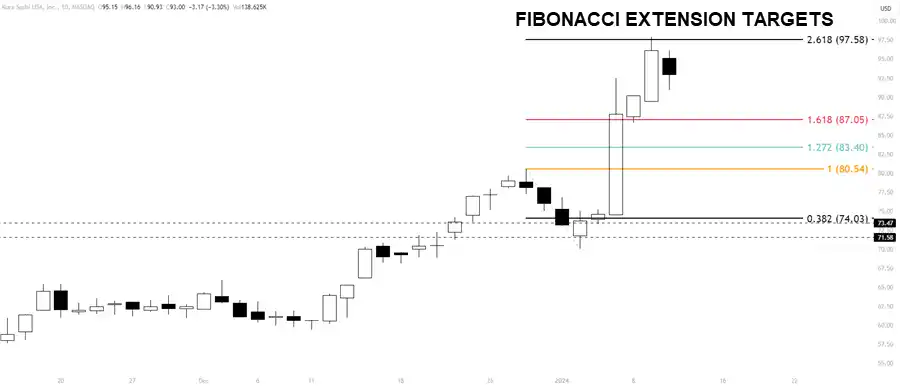 Locking in profits is a good plan, and setting precise profit targets allows you to capitalize on the pullback’s potential before the market’s sentiment shifts. When you’re planning your exit, consider using the Fibonacci retracement mark to guide your decisions. This technical tool can pinpoint where the price may resume its trend after a pullback. Combine this with support and resistance levels to enhance your assessment of where to take profits.
| Factor | Conservative Approach |
Aggressive Approach |
| Fibonacci Levels | Take profit near key Fibonacci levels | Extend targets to less common Fibonacci points |
| Support/Resistance | Secure profits at the first sign of resistance | Wait for a breakthrough in resistance levels |
| Risk Management | Set tighter targets to protect gains | Wider targets based on a favorable risk-to-reward ratio |
Your risk management strategy should dictate how you adjust your profit targets. If the risk-to-reward ratio is favorable, you might set more aggressive targets. Conversely, if the market conditions are uncertain or volatile, it’s wise to be more conservative.
Managing Risk With Stop Losses
While setting profit targets is an essential aspect of pullback trading, also important is the implementation of stop-loss orders to protect your capital against market reversals. A stop loss is a protective stop, a predetermined point at which your trade will automatically close to prevent further losses.
Here’s how you can effectively manage risk through stop losses:
- Set Stop-Loss Orders
- Based on Volatility: Adjust stop-loss levels according to the security’s volatility, providing enough room to maneuver without being stopped out prematurely.
- Trailing Stops: Implement trailing stops to protect profits as the trade progresses in your favor.
- Technical Levels: Wait for deeper pullbacks that respect technical boundaries for tighter stop placement.
Market Conditions: Impact on Pullback Trading Strategies
Market conditions play a role in the effectiveness of pullback trading strategies. Different environments, from high volatility to trending and range-bound markets, each present unique challenges and opportunities for traders. Understanding these conditions can improve your ability to capitalize on pullbacks.
High Volatility Markets
In highly volatile markets, price swings are larger and more unpredictable, which can lead to more frequent and deeper pullbacks. While this may seem like an ideal scenario for pullback traders, it also increases the risk of false signals and rapid trend reversals. To handle markets like this, traders may need to:
- Adjust their risk management, possibly using wider stop-loss orders to accommodate the increased price swings.
- Be more selective with entry points, waiting for stronger confirmation that the pullback is a temporary dip rather than the start of a reversal.
- Consider reducing position sizes to manage the heightened risk.
Trending Markets
Trending markets are characterized by a clear directional movement, making them favorable for pullback traders. In an uptrend, traders look for pullbacks as buying opportunities, while in a downtrend, they look for short-selling opportunities during rallies.
- Ensuring that the trend is strong and has not been weakening, which could signal an impending reversal.
- Using trend-following indicators like moving averages to confirm the trend’s direction and strength.
- Identifying key levels of support and resistance that could halt or reverse the pullback.
Range-Bound Markets
Range-bound, or sideways markets, occur when prices fluctuate within a horizontal channel without a clear trend. Pullback strategies in these conditions require a different approach:
- Traders might focus on the boundaries of the range, buying near support and selling near resistance.
- Pullbacks within the range can be trickier to trade, as they may not have the momentum of trending markets.
- Patience is crucial, as it may take longer for the price to move from one end of the range to the other.
Adapting to Changing Conditions
A trader’s ability to adapt to changing market conditions is essential for successful pullback trading. This includes:
- Monitor market indicators and news that may signal a change in volatility or the transition from a trending to a range-bound state.
- Being ready to switch strategies, such as moving from a pullback approach to a breakout strategy when the market moves out of range and begins to trend.
- Keep an eye on volume, as it can provide clues about the strength of a pullback. Higher volume on a pullback may indicate a stronger interest in the price level and a potential reversal point. Look for low momentum and low volume during the retracement.
Market conditions dictate the appropriate pullback trading strategies. By understanding and adapting to the current environment, traders can improve their odds of executing successful trades.
How Do Pullbacks Fail
 While it is important to know what successful pullbacks look like, you need to know how pullbacks generally fail. There are two main ways a pullback fails:
- A pullback that begins with low volume/low momentum, has a sudden increase of 4% or more in the pullback direction
- When the price is pulling back with low volume/low momentum and the price turns into a trading range, you are seeing a failure in the pullback
Studying the failures is as important as studying successful pullbacks. Nothing is stopping a trader from pivoting from a pullback trading strategy to a breakout strategy once the pullback pattern fails.
Adjusting Strategies Over Time
You need to continuously refine your pullback strategies by analyzing trends and adjusting your approach according to the market. Recognizing when the market is nearing turning points is important. Price action in these areas can signal a shift in the prevailing trend, requiring you to change your trading approach.
Adjusting strategies over time isn’t just about tweaking entry and exit points. It’s about evolving with the market. You must be flexible, and willing to modify your strategies as new patterns emerge. This includes adapting position sizing and stop levels to match the current volatility of the security you’re trading. As you become more experienced, your ability to read the signs of change will sharpen, allowing for more nuanced adjustments.
Conclusion
Trading pullbacks can be very profitable when a trader executes them with skill. By identifying opportunities, using effective entry strategies, setting clear profit targets, and managing risk with stop losses, you’re on the road to a professional approach to trading. Stay disciplined, adjust your tactics as needed, and you’ll find that trading pullbacks aren’t just smart—it’s profitable.
FAQ
What factors influence the win rate in pullback trading?
Factors influencing the win rate in pullback trading include trader’s skill, strategy, and market conditions.
What advantages do traders gain from pullbacks in trading?
Traders benefit from pullbacks with favorable entry points, trend participation, and reduced risk.
Which types of moving averages are commonly used in pullback trading strategies?
Commonly used moving averages in pullback trading are simple and exponential moving averages (SMA and EMA).
How do stock pullbacks contribute to the overall health of the market?
Stock pullbacks contribute to market health by releasing buying pressure, preventing bubbles, and creating value opportunities, enhancing stability.