- May 4, 2022
- Posted by: CoachShane
- Category: Trading Article

Trading the 5 minute opening range breakout (ORB Strategy) takes advantage of one of the most important parts of the trading day. The opening price can point to the character of the rest of the day but that is not the best part.
Data suggests that the opening print of the day will also be near the high or low of the session. Of course it is not 100% true for every trading day, but it occurs often enough to be significant. That would lead to the conclusion that the opening price shows something other than random price action.
Traders will also have a defined entry level as well as a protective stop loss level to manage risk. No guesswork involved.
What Is A 5 Minute Opening Range Breakout?
As you probably have guessed, we are looking for price to break out from the range of the first five minutes of trading.

Traders sit on their hands while the overnight action is dealt with upon the opening, including gaps. This is a 5 minute chart of Pinterest for Jan 31, 2022. We define our opening range by marking off the highs and lows of the initial candlestick. Assuming you are bullish on PINS, you would only take an upside breakout and ignore any downside break.
Why 5 Minutes?
There was a time where 30 and 60 minute range breakouts were very popular. In a time where market data is now faster and we have quick entry methods for trading, many traders opted for the lower time frame.
Big benefit? Some days, the character of the instrument is set off the open. Entering near the open on a strong trending day is a wonderful way to book profits.
There are also traders who use the shorter time frame as an entry chart on a higher time frame setup. I discussed that in my post about day trading the 5 minute chart.
Using the 1 Minute Opening Range Breakout
Once we get into this extremely short time frame, your decision making skills will be challenged. This is a one minute chart of MPC and the daily chart had rallied off the lows of a pullback. Price then went into a sideways range.
The one minute chart shows a strong rejection of lows during the one minute opening range. Buy stop or enter a market order when price breaks the high of the range or add a few cents to the breakout point.
Opening Range Breakout Strategies
There are many variations of trading the ORB, from playing the actual break of the range, to looking for continuation in the price action. Each trader is going to have to define their own intricacies of a trading strategy but you have the foundational knowledge that the opening price does have some significance for the session.
If we consider playing the breakout, what strategy are we really playing? A support or resistance failing trade.
Each high or low of a candlestick can be considered a short term support/resistance zone. Some zones will appear stronger due to the size of the upper or lower shadow.
There are ways to determine if a breakout has a higher probability of succeeding and those are discussed in detail: Secrets of Trading Breakouts. There are price action clues you can consider. Often times, price will break a range and pull back. This is the normal ebb and flow of price action and adds another strategy you can consider.
Range Breakout Strategy 1
For this strategy, you will use the one minute chart but will wait until the five minutes have elapsed. Why the one minute?
While you could just trade the break of the 5 minute opening range, what is wrong with looking at price action leading up to it?

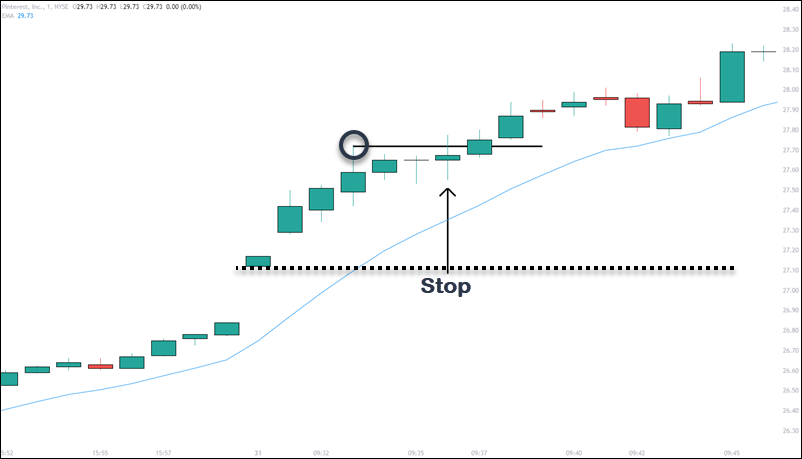
Going back to the early chart of PINS, this is the one minute chart. I have applied a 10 EMA as an overall direction of the short term trend. Let’s break the chart down:
+ Price gapped up on the morning and put in a high at 9:33. We need to wait a few more minutes
+ Price backs off from the high but stays just below resistance – this is bullish
+ Price breaks above the high at the arrow but fails to close above the 5 minute high
+ We enter a long position when the first candle closes above the range
+ Stop loss goes below the low of the range
+ Profit targets can be fixed at 1.25R (1.25 X your risk) OR using the moving average to trail your stop
This next chart is the session only crude oil futures 1 minute chart for Feb 1, 2022.
It is a great example of different approaches you can take for the breakout trades. It’s also not a cherrypicked example to make strategies look golden but shows the reality of trading.

Price had gapped down and we let the first 5 minutes play out.
Unlike the PINS chart, price had pulled back (PB) off the low of the five minute range. Price would have to drop .23 to get back to the lows. The pullback gives us an opportunity to enter before the breakout.
There are many ways to enter a reversal and in this instance, we can short the low of the inside candlestick that shows up as we anticipate the breakdown of support of the five minute range.
If you decide to trade the pullback, our stop loss would go above the high point of the pullback which is the proper location to stay true to the pattern.
In this case, crude oil made a measured move into the lows and began to range.
This next chart is a Forex example – 1 minute candle chart. Since FX is open 24 hrs, we would look to the opening of the higher volume sessions. This example is the EURJPY at the opening of the U.S. session.

Interesting to note that price action was contained inside the five minute range for about 20 minutes. At the black arrow, we get a strong close above the range high. After a slight pause, price moved to the upside. Also note that price was making higher lows into resistance as well as ranging just under resistance. All those indications pointed to a bullish breakout of the 5 minute trading range.
You can keep it simple and just watch the five minute chart and trade that. In my opinion, if we have the ability to obtain more price information by looking at the one minute to increase our odds, it makes sense to do so.
There will be times when price gaps at the open. Learning what gaps are which and how to trade gaps, is another tool for a trader.
Range Breakout Strategy 2
If you agree that most breakouts fail, then letting price breakout and then have a reaction move, may suit you better.
Think of it this way: traders enter at the open and when price is moving directionally. At the first sign of pause, those traders exit. We can also get traders involved looking to play the opposite direction.
By waiting for the pullback to an area around the high or low of the range, which may never come though, you position yourself after the market has digested trade entries and exits.
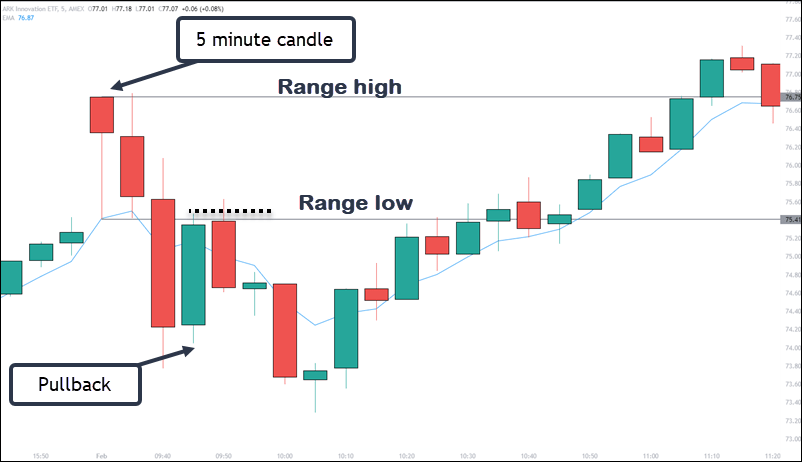
Here is a 5 minute chart of AARK for Feb 1, 2022.

We see that price has broken through the range low and instead of entering a trade, you wait until price retraces to an area around the breakout area.
The green candle pulls back and the red candle that was initially a green candle, is the entry.
How?

Remember, that red candle had to be green at one point as it moved up off the opening price before reversing.
Traders could also, depending on the pullback, enter the trade when the candle breaks back below (for shorts) the moving average.
This is CRWD and is intentionally not a good example.

After price breaks down, we see the pullback occur and keeps on going into the middle of the range that was formed at the open.
You will have you to determine what the character of the pullback looks like that you will trade.
- Is a pullback close to or at the range level good enough?
- How far can price travel back into the range before invalidating the setup?
As you answer those questions, remember that we are looking to take advantage of early morning momentum. If price can pullback and, as shown in this example, form a range, is that showing momentum?
Support And Resistance
To take the strategies to another level, will you incorporate support and resistance zones?
Heading back to the CRWD chart, you can see that the initial breakdown ran into an obvious support level.

This is price discovery in action as price tested both high and lows of a larger range.
What started as a 5 minute opening range breakout strategy changed to a support holding setup. I think it is important that traders have a few trading strategies up their sleeve to take advantage of opportunities such as these.
The takeaway is to monitor the chart to see if there is a support or resistance level close to your entry point. If so, will you take quicker profits, skip the trade, or ignore the level?
What About Profit Targets and Stops?
Taking profits, just like placing stops, has many approaches that will be different for each trader. For these strategies, the worst case scenario is entering a trade, price reversing and taking you out. This is why to manage our risk, we place the stop at a point that will invalidate the trade.
+ Playing the breakout will have your stop at the other extreme point of the range
+ If using pullbacks, your stop will go at the turning point of the pullback
The best case scenario is price taking off on a trending day.
+ Traders can use the moving average as a trailing stop loss
+ Use a multiple of your risk for a target
+ Look for a price action reversal and exit when the momentum stalls
Whatever you choose for profit taking and protective stop loss, be consistent.
Conclusion
While far too many videos and websites makes trading these strategies seem easy, they are far from it.
The criteria is simple. However, as shown in the support and resistance section, your approach to a trade will change. Price can do a few things, trend up, trend down, or range sideways. You should be able to understand the difference and have techniques to handle each of these.
With the pullback, how far is too far?
To learn how I look at pullbacks, check this post on trading pullbacks the better way. There is a criteria you can use to ensure you are not entering when price is looking to reverse.
What to trade?
While you can scan for instruments, I have always found it best to have a list of instruments that I trade on a regular basis. In fact, if I know some news is coming out for a particular stock or we had earnings, I can keep that ticker on the top of my list to watch for the trading day if looking for an ORB trade.
Using the 5 minute range gives traders a disciplined approach to framing the market. You have a defined zone to look for a trade and it is a zone that actually has meaning.
To get started, pick one of the two strategies mentioned and go back over some charts. Map out some criteria to watch for and see what suits you as a trader.

