- November 9, 2021
- Posted by: Shane Daly
- Category: Trading Article

When price breaks a certain level, breakout traders pile into the move looking for fast price moves to capitalize on.
From support and resistance zones, to price swing pivots and even the extremes of individual candlesticks, playing a breakout can be exciting.
There is nothing more gratifying to see price move favorably in your direction without any threat to your protective stop.
It can be exhilarating.
 Until it isn’t.
The truth is that most breakout trades don’t simply take off and trend.
From falling back into a range (some call it a false breakout), to pulling back to revisit the breakout price, to complete failure to advance, trading breakouts is not for those who think trading is painless.
You are trading in a potentially highly volatile area with competing forces at play when breakout trading.
Are there methods to determine which breakout has the potential to be less painful as another?
Yes, there is.
A breakout trading strategy that includes some of what I am going to cover, will be in better shape than one that ignores them.
Which Direction To Consider
While counter trend trading is another tool you can use as a trader, trading in the direction of the trend is a better bet for breakout strategies.
There was (may still be) an approach where you would bracket both sides of a trading range. There is no edge in that.
If you decide to turn around on a highway and head into traffic, it has the potential to be a painful drive.
Consider only trading in the direction of the trend for your time frame. Yes, you can use multiple time frames however, until you can master one time frame, forget another.
Which direction would you play on this daily chart of Alibaba?
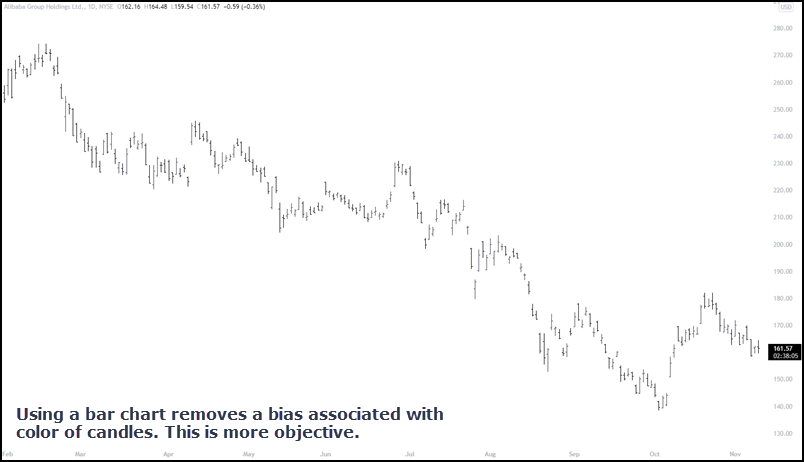
It’s pretty obvious that looking for sells is the better play on the daily chart.
What about Netflix?

Higher highs and lows would tell me that long trades would be a good choice as the stock, overall, makes higher prices.
Room To Run – What’s In The Way?
Once the breakout occurs, we want to see that there is enough room in the trade before slamming into potential support or resistance levels.
While price could break these levels with ease, we are risk managers first. Is there enough room in the trade to at least be able to adjust your protective stop?
Key point: I am not talking about the original level that you need to break through. This will be important in another point later in this article.

There are several potential breakout points on this chart. The main roadblock to price movement is the top and also the obvious swing level on the chart.
The was potential resistance level until acting as resistance (proving itself) and sending price back down even after a momentum push up.
You will find close by price levels that can cause your issues more on the lower time frames. That is why I personally use the daily charts and weekly for all my trading setups.

We do see price holding up briefly at the former resistance level.
True support levels will be the key level to look for when short from a breakout.
Why?
Those long over the resistance area place their protective stops under main support zones. You can see the price action around the support level on this chart is more active than the resistance level that is now acting as support.
When the market is seeking flow, it will look for the stop-loss orders in the market.
Look For Bullish or Bearish Clues
When we are looking to play breakouts in the direction of the trend, we want to find those that offer the best reward.
To do so, looking for a building of interest, either bullish or bearish, is vital.
Think of bargaining for an item. You would only pay higher if you truly wanted the item.
So will others.
That is how an auction house gets more for an item than it was initially offered for.
There are a few clues I look for.
Hugging price zones
If price is up against resistance and is failing to break down, that is a bullish sign that the breakout, when it happens, could move quickly in your direction.
This is an extreme example where we see basing under resistance and a strong gap up over the highs.
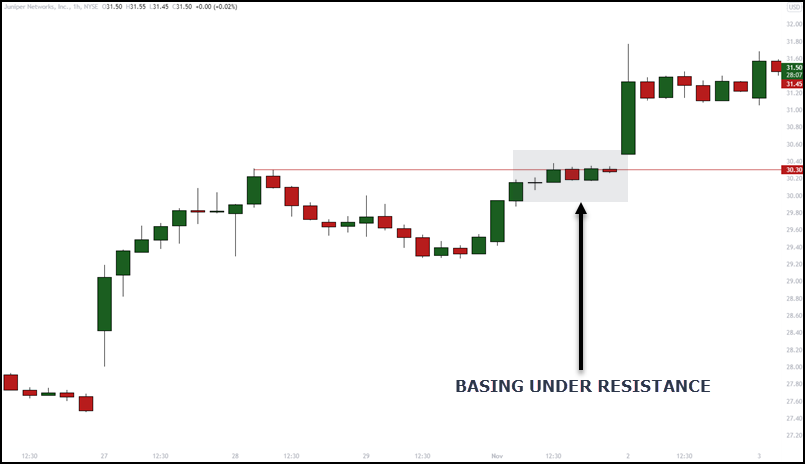
I don’t like breakouts that start with price rocketing off of lows like this chart shows. Often times those that were long from the bottom, ride the breakout, and then sell their positions. This leads to a quick pullback into the range.
The basing, the pause in price advancing, shows there are still buyers coming in at this price level and perhaps longs unwinding some of their positions.
Higher lows into resistance (lower highs into support)
When people are continually buying at higher prices, this shows intent in that direction. It is a sign of strength.
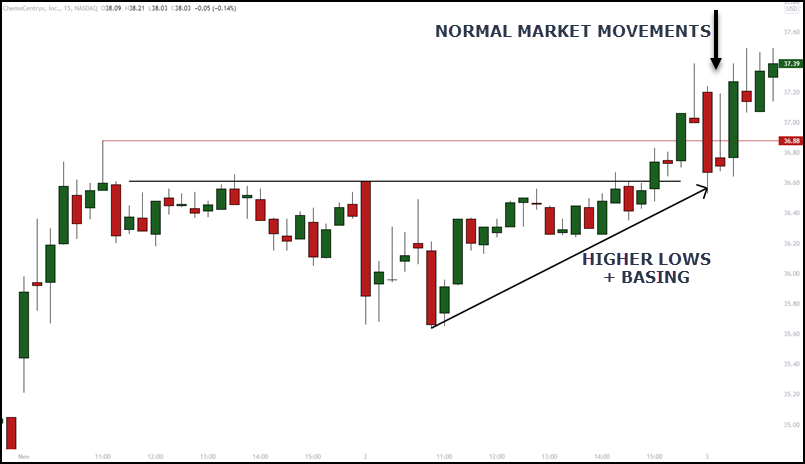
Contrary to common teachings, price pulling back into a range after a breakout is not abnormal. It is not a failure.
Think of those long into the breakout. They are in profit and offering up their shares for new buyers to get out of their positions.
Unless price rips through halfway of the range, I look at this as normal movement. Chart patterns are not perfect and you can’t expect them to play out as the textbooks promise.
Yes, the high with the red line is close to this breakout level. However, it is all part of the same price range and I am using a lower time frame for the example.
Rejection of lows
This is called everything from trapped traders to pin bars.
I call it failure tests of highs or lows which are indicative of price rejection.

Price dips below the range of the basing at resistance.
Buys can be initiated at the close of the candle or a break of its high.
The circle indicates price putting in a new high and dropping back.
Would you have entered?
This is a daily chart and it depend on what your entry point is:
- Enter on strong close above level?
- Enter with buy stop orders when price breaks a certain price?
- Enter next day if price breaks the high of the breakout candle?
- Enter in the base?
There is no right answer.
I will do all of those depending on what the chart is looking like.
A Word About Trade Entries
Earlier, I made a key point talking about the main support or resistance level for breakout trades.
Entries that take place prior to the actual breakout (based on what we’ve discussed), will have you entering before the actual breakout.
Some may think that is a high risk move:
- Basing under resistance or over support can give you enough room to manage a trade
- Entering on a failure test of lows or highs has you entering with plenty of room to manage a trade upon breakout

The green line is the entry.
The box on the left has you entering somewhere in the basing pattern. The exact point in the basing does not matter.
The right box has you entering after a failure test of lows.
Both entries give you room to manage your risk but also a great entry if a new trend run is underway.
You could even consider using the break of an inside bar which is just another consolidation but on a lower time frame.
Protective Stop Placement
If you place your stop loss just under the breakout price level for longs, you are ignoring the rhythm of the market.
Price coming back does not invalidate the trade.
Depending on the range you are trading:
- Stop loss under the entire range
- Consider halfway inside the range
- Consider ATR from entry
- Under any obvious price rejection
While there is no perfect answer, giving your trade room to breath and to accept the normal gyrations of the market is the best play.
Should You Use Profit Targets?
That depends on what you want from the trade.
What do you want from your trading?
There are good arguments for different exit points:
- Using a trailing stop method
- Multiples of your risk for exits
- Scaling out of your positions
Trailing stops can be great for catching a trend but can also take you out before a big run.
Multiples of your initial risk is an objective and consistent way to take profits. You will miss the big moves.
Scaling out as the trade goes in your direction reduces risk but can also give you:
- Full position loss if trade goes against you from the start
- Partial position gains on the big runners
Anybody that tells you “this is the best way” to do anything, would be incorrect.
It is not just a line when you hear that you need to know yourself as a trader.
Wrap Up
You will never be a perfect breakout trader.
You will have losses.
You won’t always catch the big moves.
You can mitigate the downfalls of breakout trading by following what we have talked about:
- Look for a breakout in the direction of the trend for your time frame
- Make sure there are no potential resistance levels or support near the entry that may not allow for trade management.
- Look for the bearish clues for shorts and bullish for longs
Above all, your protective stop-loss order must be set to protect the downside of your trade.
1 Comment
Comments are closed.
Love this ❤️