- February 16, 2023
- Posted by: Shane Daly
- Category: Trading Article

When it comes to options trading, one tool a trader can use is trend lines. Trend lines represent the history of price movements in an asset and can be used to identify support and resistance levels as well as predict potential future price zones. They can also be used as a proxy to determine momentum and cases where prices are overextended.
By understanding how trend lines work, traders can make more informed decisions and maximize their returns with options trading.
Let’s take a look at what trend lines are, how they can be used, and some strategies for maximizing returns with options trading using trend lines.
What Are Trend Lines?
Trend lines are angled lines that connect two or more points on a chart. These points represent the highs and lows of past prices over a certain period. Trend lines can be converted into channels that show if there is a change in the rhythm of price movements. In options, depending on your strategy, you either want to see strong directional moves or even cases of range-bound instruments.
Identifying Key Support and Resistance Levels
Trend lines are often used to identify key support and resistance levels which show where prices may stop going up or down respectively. A support level is when the market finds it difficult to move below a certain price point while resistance occurs when the market cannot break through a certain price level. Understanding these levels allows traders to better plan their trades by looking for entry or exit points near these areas.
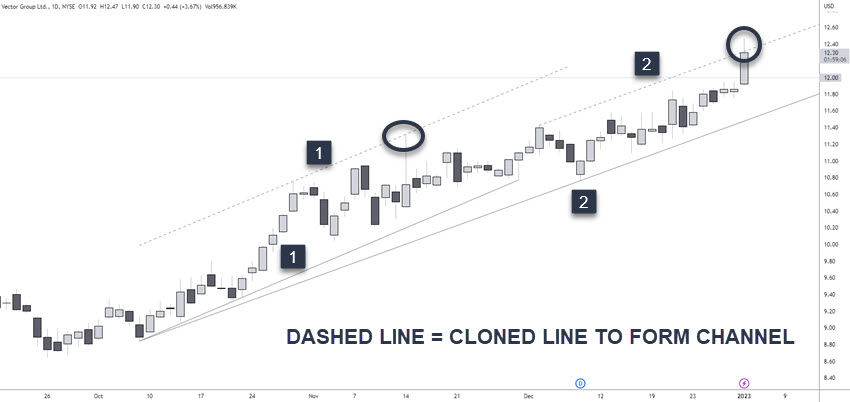
In the attached image, the solid lines are drawn where there were two lows to connect to. The dashed lines are placed at the swing high between those two points. If a new high is made, you can drag the dashed lines to the new high to reflect the new reality. If the bottom lines begin to cut through price, redraw to avoid that. Remember, these are areas and not precise price points.
Using Trend Lines to Make Profitable Trading Decisions
Trend lines are also used to make trading decisions by providing insight into potential profits from an option trade. For example, if there is an uptrend in an asset’s price, then you may buy calls on that asset with the expectation of higher prices. Prices will generally rise until an overhead supply level is reached.
Similarly, if you spot a downtrend in an asset’s price then you may buy puts on that asset since its price should continue falling until it hits its support level.
There is a phenomenon in price movement called measured moves. This is where one move in an instrument is close to or equal to a previous move. Nothing magic here except prices will move with similar volatility until some market-moving news hits the wire. This is why you will see prices trade inside a channel for a time before exploding in one direction or another.
At Netpicks, while we do use basic calls and puts at times, we often resort to using vertical spreads for our options trading.
Using trend lines can help an options trader who is expecting a directional move to know when it may be time to exit the trade.
Maximize Returns With Options Trading Using Trend Lines
When using trendlines in options trading, several strategies can be employed to maximize returns including buying calls/puts based on expected direction changes in the market, writing covered calls/puts based on expected trends continuing in their current direction, implementing straddle trades based on expected volatile movements, and more.
Time matters with options trading and sitting in a position during a retracement in price can be devastating to your position. Using trend lines and more specifically trend channels, you now have a probable area where price may stall or worse, move against you.
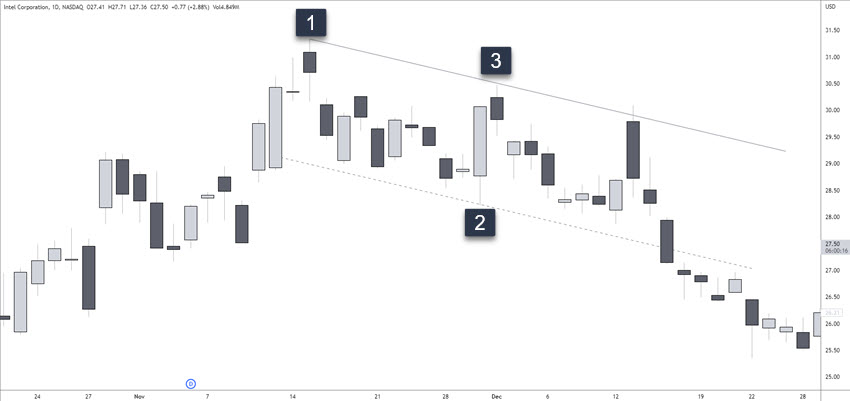
INTEL is in a downtrend and has been since April 2021. On a recent rally, price puts in a high at number 1. Price ranges and finds a low at number 2. We need a swing high to connect to number 1 and we get that at 3. We then clone the line to attach to the low at 2. Imagine you are looking to buy a put option when price returns to the upper trend line.
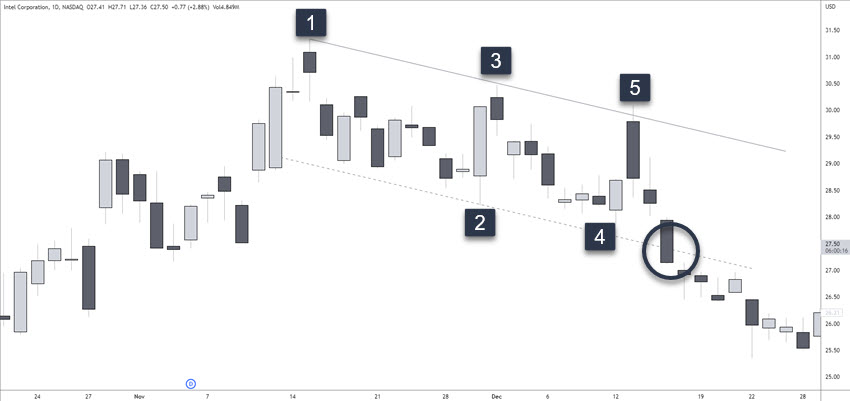
When price returns to the area of the upper trend line, you buy a put option and choose the strike price where the high of 5 is made ($30.00). We teach our traders to look at buying contracts that are 1-2 strikes in the money with expiration dates 20 – 60 days out. If the VIX is above 15, which it was on the day high five was made, we can look at shorter term weekly options with 7 – 20 days to expiration.
Our risk on the trade is whatever it cost to set the trade up. As an example: Buy 1 30 put $3.30. The max risk we have is $3.30 per share or $330.00 per options contract. The premium will be impacted by your expiration date. A further out expiration will be more expensive as the underlying will have time to make a directional move. Near term expiration dates are cheaper but come with less time value.
Entry And Targets Are Set
The benefit of using trend lines/channels is our entry price and our targets are already set. In our example, we want to manage or close the trade at the lower trend line which was $27.00. Note that while the channel did break, there was not much price movement afterwards and time decay begins to add up. The issue with buying calls and puts is you need that directional move to occur quickly and do not want to sit through any sideways action.
Our profit potential is good on this trade as theoretically the stock can plummet to zero. Our risk is defined by the cost of the trade but we need a directional move quickly.
Using A Vertical Spread
If I am bearish, buying a put option is one way to be involved in the stock. Using a vertical spread is another way and while cheaper, it does come with limited profit potential.
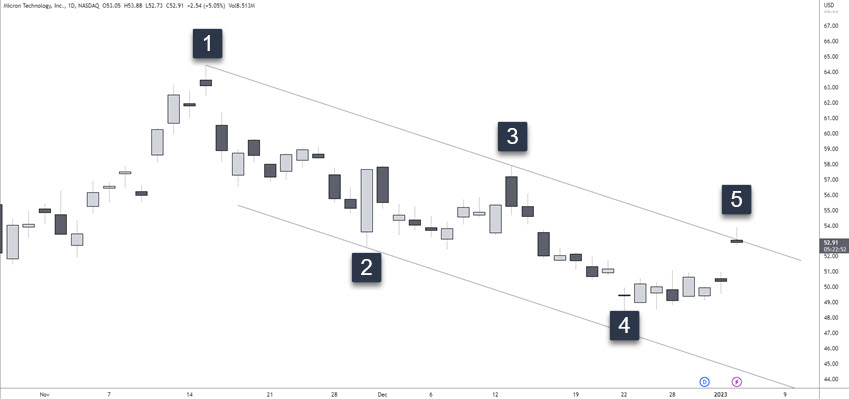
Imagine you want to short MU and you use the trend line technique we’ve been discussing. Price has gapped up to the upper channel line and you want to take a short position.
At the time of this screen capture, 1 53 put $2.54. Remember, you are bearish and perhaps you want to lower your cost for the trade while still having a defined risk.
Enter Long Vertical Put Spread
To set up this trade, you would buy one put while selling another.
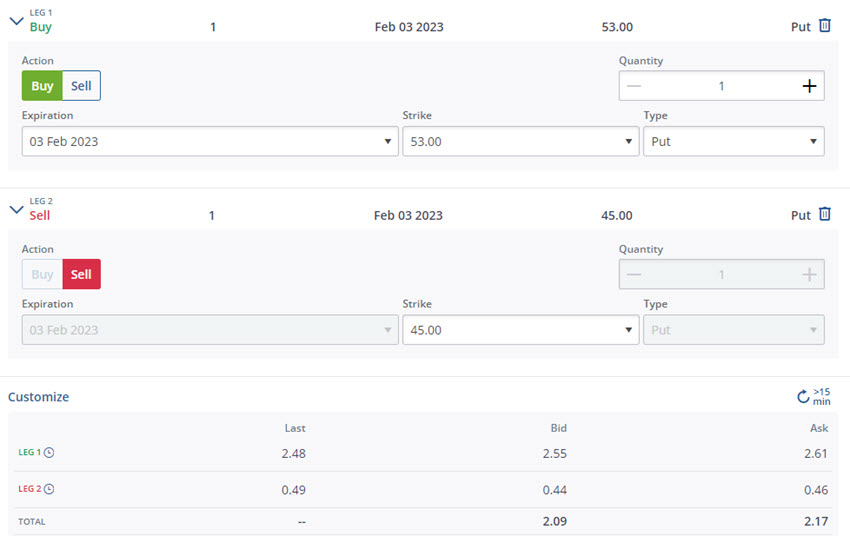
We buy 1 53 put $2.55 | We sell 1 45 put $0.44 = Total cost is $2.09 (using the bid example from this broker)
Essentially, we have the right to sell 100 shares of MU stock at $53.00 and the obligation to buy the stock at $45.00, if exercised.
Our profit potential on this trade is limited to the difference between the long and short strike of $8.00 minus the cost to put on the trade: $2.09 = $5.91 ($591).
The max risk we have is limited to what we paid for the trade: $2.09 ($209).
Our breakeven price is the long strike of $53.00 minus the cost of the trade = $50.91.
By using a vertical spread, we reduced the cost of the trade from $254.00 all the way to $209.00.
In a perfect scenario, the stock will come close to the lower trend line which is our short strike of $45.00.
5 Quick FAQS
• Using trend lines/channels can help define entry and target prices
• Put options can be bought when the price returns to the area of the upper trend line
• Vertical spreads can be used to reduce costs while still having a defined risk
• Maximum risk is limited to what was paid for the trade in these examples
• The opposite side of the channel is your take action zone
Conclusion
By using trend lines, we can set up entry and exit points for trades. When trading options, buying puts or calls is one way to take advantage of bearish markets while vertical spreads offer a lower cost alternative with limited profit potential in comparison. In either case, traders need to ensure that they are aware of the risks associated with trading and the strategies that you are using.