
- September 17, 2025
- Posted by: Shane Daly
- Categories: Basic Trading Strategies, Trading Article

You’ve noticed those times when the market seems to catch its breath, forming smaller price bars inside a larger one. That’s exactly what happens in a Double Inside Bar Pattern, where two consecutive bars nest within a mother bar’s range. This powerful formation can signal an upcoming breakout and give you clear entry points for potential trades.
TLDR
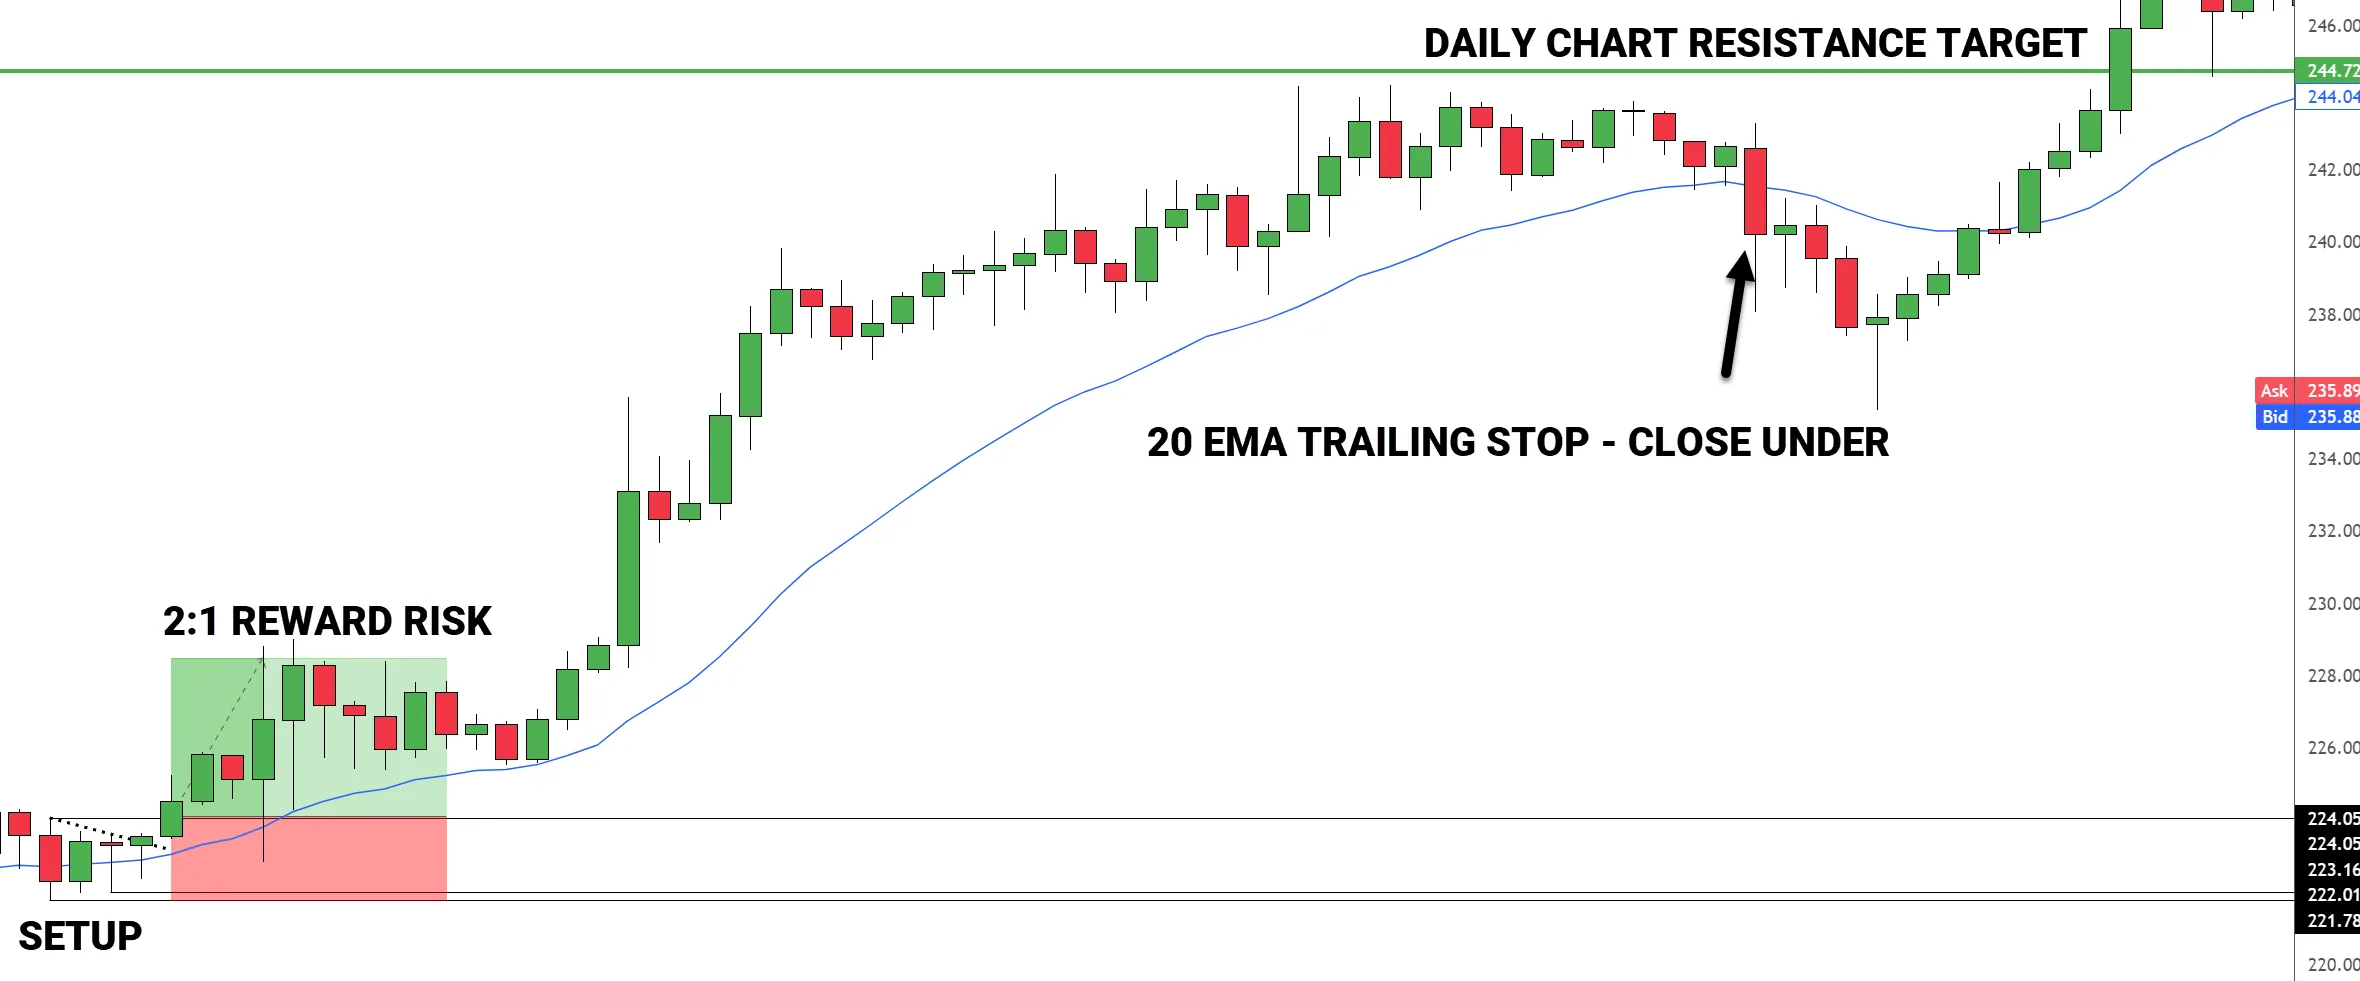
- Double Inside Bar pattern consists of a mother bar followed by two consecutive smaller bars contained within its range.
- Enter trades using buy stops above mother bar’s high for upward breakouts or sell stops below mother bar’s low for downward moves.
- Place stop losses beyond the mother bar’s extreme for conservative strategy or beyond second inside bar for aggressive approach.
- Target profit ratios of at least 2:1, with many traders aiming for 3:1 or higher reward-to-risk scenarios.
- Trade the pattern in strong trending markets during consolidation periods, avoiding choppy or sideways market conditions.
What Is a Double Inside Bar Pattern?
The Double Inside Bar Pattern is one of the most intriguing setups you’ll come across. When you’re studying historical significance in trading, you’ll find this pattern has stood the test of time because it clearly shows market consolidation before a significant move.

The pattern consists of three candlesticks working together. First, you’ll see a larger “mother bar” that sets the stage. Then, you’ll notice two smaller bars that nest inside each other like Russian dolls.
Through volatility analysis, you can see how each bar becomes progressively smaller, showing that the market’s taking a breather – consolidating. Think of it as a coiled spring – the tighter it gets, the more powerful the eventual release might be. When you spot this pattern, you’re essentially watching the market gather itself before deciding which direction it wants to break.
This setup works best when there’s prior market imbalance between buyers and sellers, creating the potential for a powerful breakout move.

How to Identify This Pattern on Charts?
Once you understand what to look for, spotting a Double Inside Bar Pattern becomes quite easy.
When analyzing chart patterns, you’re searching for a specific three-candle sequence that shows market compression. Start by locating a larger “mother bar,” then look for two consecutive bars that are contained within each other.

For effective market analysis, check that each inside bar is completely held within the previous bar’s range. You’ll notice the high of each new bar is lower than the last bar’s high, while the low is higher than the previous bar’s low.
The pattern creates a distinctive “coiled spring” appearance, with each subsequent bar getting smaller. You’ll see the candlesticks stacking within each other, forming a tight consolidation that resembles a triangle.
When viewed on higher timeframes, this contained structure becomes particularly clear and easy to spot.
Best Market Conditions for Trading This Pattern?
After you’ve spotted the Double Inside Bar Pattern on your charts, identifying the right market conditions becomes your next key focus.
You’ll want to look for strong trending markets where this pattern forms during brief consolidation periods. The pattern works best when market volatility is high and trend strength is clearly visible, especially near key support and resistance levels.

For the most reliable trading opportunities, watch for these specific conditions:
- Strong directional trends where the pattern appears as a natural pause, suggesting the market is taking a breather before continuing
- Areas near important technical levels, such as moving averages or previous swing points, where the pattern can signal a powerful continuation
- Volatile market environments evolving into breakout moves, as the compressed price action often leads to explosive momentum
Avoid trading this pattern in choppy, sideways markets where false breakouts are common and price action lacks clear direction.
Consider using momentum indicators like RSI and MACD to confirm the strength of the underlying trend before entering trades based on this pattern.
How to Enter Double Inside Bar Trades?
When you’ve identified a Double Inside Bar pattern, entering the trade requires precise order placement to capture the breakout momentum.
To enter trades effectively, you’ll want to place your orders just beyond the mother bar’s boundaries – specifically, set a buy stop order 2-3 pips/cents above the mother bar’s high for upward breakouts, or a sell stop order 2-3 below the mother bar’s low for downward moves.

The key is patience – don’t jump in during the consolidation phase. Instead, wait for the price to break out of the compressed range. Your stop order will automatically trigger once the breakout occurs, putting you in position to ride the momentum.
This method ensures you’re entering the trade in sync with the market’s chosen direction. Some traders prefer using the pattern’s entire high/low range for entry points, but the mother bar boundaries typically offer cleaner entry signals.
Trading in higher time frames generally provides more reliable breakout signals due to broader market participation and reduced noise from economic releases.
Where Should I Place My Stop Loss?
Stop loss placement in the Double Inside Bar Pattern offers two reliable approaches to protect your trading capital. You can choose between a conservative or aggressive stop loss strategy based on your risk tolerance.

The conservative approach places your stop loss beyond the mother bar’s extreme – below the lowest low of all three bars for long trades, or above the highest high for short trades. Be careful of using very large mother bars. These give you larger risk and if using a reward/risk target, profit targets further out from price.
For a tighter approach, you can set your stop just beyond the second inside bar’s boundaries.
- Conservative stop loss placement gives your trade more room to develop and reduces the chance of premature stop outs.
- Aggressive stop loss levels offer tighter risk control but may increase the likelihood of being stopped out early.
- Your chosen stop loss strategy should align with your overall risk management plan and account size.
What Are the Profit Targets and Exits?
Successful profit-taking with the Double Inside Bar Pattern relies on establishing clear targets and exit rules before entering your trade. Your profit strategy should aim for at least a 2:1 reward-to-risk ratio, though many traders target 3:1 or higher due to the pattern’s tight stop loss placement.
You’ve got several exit planning options to choose from. You can trail your stop loss behind swing points to ride trending moves, take partial profits at predetermined levels like 1:1 and 2:1, or target the next major support or resistance level on higher timeframes.
If you’re concerned about a sudden reversal, consider closing your position if it hasn’t reached your targets within 5-10 bars, as the pattern’s momentum advantage tends to fade.
The key is to stick to your predetermined exit plan rather than making emotional decisions during the trade. Similar to 5-minute breakout trades, continuous monitoring of your charts is essential for identifying new opportunities and transitioning between strategies.
Which Timeframes Work Best for This Pattern?
Choosing the right timeframe can impact your success with the Double Inside Bar Pattern. While this versatile pattern works across all timeframes, higher intervals typically produce more reliable signals with fewer false breakouts.
The daily and 4-hour charts provide an excellent balance between trading opportunities and pattern quality.
- For scalping strategies, you can use 5-15 minute charts, but remember that shorter timeframes may show patterns due to low volatility rather than meaningful consolidation.
- Swing trading works best on 4-hour and daily charts, where the pattern reflects genuine market indecision and potential trend changes.
- Position traders should focus on daily and weekly charts, where Double Inside Bars often precede significant market moves.
The key is matching the timeframe to your trading style and schedule. While you can trade this pattern on any chart, higher timeframes generally offer better reliability and fewer whipsaws. Having a proven trading strategy with clear risk management protocols is essential for minimizing losses when trading any pattern.
Common Mistakes to Avoid Trading This Pattern?
One of the biggest psychological factors affecting traders is the urge to enter trades too early, before the pattern actually breaks out. This premature entry often results in getting caught in false moves and unnecessary losses.
Your trading discipline needs to be strong to avoid common pitfalls like taking signals in choppy markets or treating every inside bar as a trading opportunity.
You’ll want to manage your risk properly by never risking more than 1-2% of your account on any trade. Stop placement is important to your success- don’t set them too tight or too loose. Instead, calculate your position size based on the proper stop distance.
If price closes back inside the mother bar after breaking out, don’t hesitate to exit – it’s a sign the pattern has failed.
Your Questions Answered
How Does the Double Inside Bar Pattern Perform in Different Market Volatility Conditions?
You’ll find that double inside bars work best in moderate volatility conditions when market trends are clearly defined.
During high volatility, the pattern’s tight consolidation is less likely to hold, leading to false breakouts.
In low volatility, you might struggle to get meaningful price movements after the breakout.
The volatility impact is important to understand- aim to trade this pattern when market conditions aren’t too extreme in either direction.
Can This Pattern Be Combined With Other Technical Indicators for Confirmation?
You can improve the double inside bar pattern by adding momentum indicators like RSI or MACD to confirm the breakout’s strength.
Volume analysis is especially helpful – look for increased volume during the breakout to validate the move. Keep in mind that successful breakouts don’t have to have higher volume.
Just don’t overcomplicate it – use one or two indicators max.
What Is the Average Success Rate of Double Inside Bar Trades?
Success rates for double inside bar trades typically range from 45-65%, depending on your trading style and market sentiment.
You’ll see higher success rates when you combine the pattern with strong trader psychology and proper market context.
Remember, it’s not just about win rate – your risk-reward ratio matters more.
Many traders achieve better results in trending markets versus choppy conditions.
How Long Should Traders Wait for a Breakout Before Abandoning Setup?
You shouldn’t wait more than 3-4 candlesticks after the second inside bar forms for a breakout.
If there’s no clear breakout within this timeframe, it’s best to abandon the setup and look for new opportunities.
Your trader patience is important, but waiting too long can mean you’re dealing with a different market context.
The breakout timing sweet spot is typically within these first few bars.
Does the Size Ratio Between Mother Bar and Inside Bars Affect Success?
Yes, size ratios matter significantly in your trading success.
You’ll want to see a mother bar that’s notably larger than the inside bars, ideally 2-3 times their size.
This size comparison helps with trading psychology because it shows a clear shift from high to low volatility.
When the inside bars are too large compared to the mother bar, you’re more likely to encounter false breakouts and choppy price action.