- March 20, 2024
- Posted by: Shane Daly
- Categories: Advanced Trading Strategies, Trading Article

To trade with price action, you observe and interpret the movement of market prices to make trading decisions, rather than relying on technical indicators. This approach focuses on real-time price data and trends to predict future market behavior.
Recognize trends, patterns, and candlestick formations to help make your trading decisions based on market conditions. Use key candlestick formations for market movements, determining entry and exit points while practicing patience, discipline, and adaptability. By mastering these techniques, you can develop a strategic edge in trading that will enhance your success and risk management.
Main Points
- Learn to analyze historical price movements for insights.
- Focus on recognizing common candlestick patterns.
- Practice identifying high-quality price action for trading opportunities.
- Understand market behavior to make informed decisions.
- Emphasize entry and stop-loss logic for effective trading.
Understanding Pure Price Action
To understand the essence of pure price action trading, focus only on historical price movements for clues into current market conditions. In this form of trading, you analyze price charts without the assistance of indicators or oscillators (or very minimal).
By understanding the raw data of price movements, you can gain a better understanding of market behavior and what potential moves are to come. Price action tools such as candlestick patterns and chart formations become your “tools of the trade” as a trader. Learning to interpret these patterns is the goal of developing a successful price action strategy.
The goal of pure price action trading is to predict future price movements based on past price data. By being able to read the charts and understand the meaning of price action, you can make better decisions in the market that are based on what is happening in real-time.
Identifying Candlestick Patterns
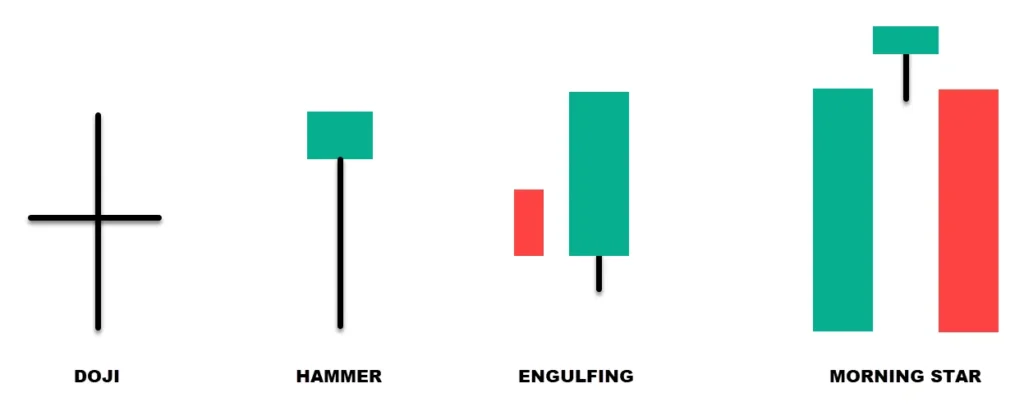 When identifying candlestick patterns, keep an eye out for common ones like:
- Doji
- Hammer
- Engulfing
- Morning Star
These patterns can give you clues into potential bullish or bearish signals in the market. Developing the skill to recognize these patterns will be vital for your price action trading success.
Bullish and Bearish Signals
Identifying bullish and bearish signals through candlestick patterns is essential for predicting potential price movements in the market. Bullish signals, such as the Hammer, Bullish Engulfing, and Morning Star patterns, suggest possible upward price movement.
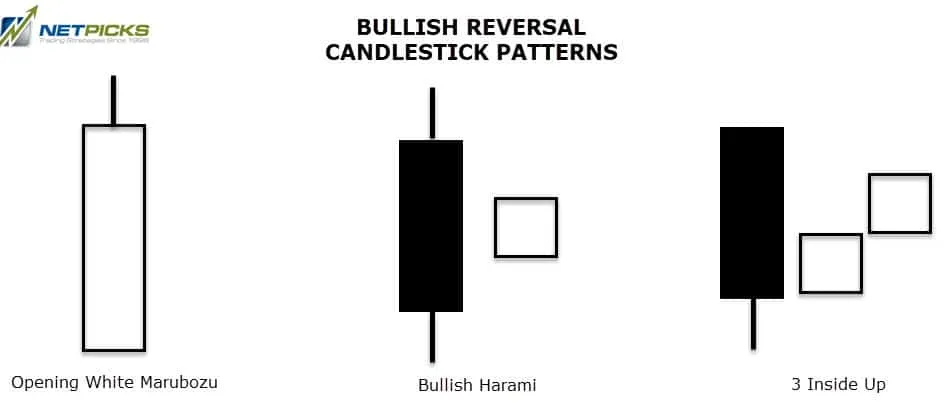
Bearish signals like the Shooting Star, Bearish Engulfing, and Evening Star patterns indicate potential downward price shifts. These candlestick patterns offer insights into market sentiment and potential changes in price direction, aiding traders in making informed trading decisions within price action trading.
Pattern Recognition Tips
To improve your trading skills, mastering the art of recognizing candlestick patterns is an essential step toward predicting market movements effectively. Here are some pattern tips to help you get a handle on price action patterns:
- Understand the Psychology: Dive deeper into the emotions and sentiments behind candlestick patterns to make more accurate predictions about potential reversals or continuations.
- Combine with Technical Analysis: Utilize candlestick patterns along with other technical analysis tools to strengthen your decision-making process and enhance your understanding of market trends.
- Practice and Consistency: Regularly practice identifying candlestick patterns in different market scenarios to improve your recognition skills and adaptability to changing price movements.
Analyzing Price Action Quality
Assess the strength and reliability of price movements in the market by analyzing price action quality.
When you explore price action quality, you’re examining the robustness of signals, trends, patterns, and breakouts. High-quality price action stands out with its clear and decisive characteristics, making it easier for traders to identify potential high-probability trading opportunities.
| Stage | Description | Key Observations |
|---|---|---|
| Consolidation Phase | Stock trading in a narrow range, forming a pattern like a rectangle or a triangle. | Balance between buyers and sellers, indicating uncertainty. |
| Volume Increase | Noticeable increase in trading volume. | Suggests growing interest and potential impending price movement. |
| Breakout | Stock breaks above the upper boundary of the pattern. | Clear indication of buyers taking control. |
| Confirmation & Trade | High volume confirms the breakout. | High probability of opportunity to buy. |
| Stop-Loss & Profit Targets | Setting a stop-loss order just below the breakout point. | Minimizes losses if the breakout fails. Set profit targets based on resistance levels or risk-reward ratio. |
By focusing on price action quality, you can effectively filter out market noise, honing in on trades with greater potential. This approach not only enhances your chances of success but also plays an important role in effective risk management.
Recognizing Market Behavior
Identifying market behavior is vital for your success as a price action trader. By recognizing trends, interpreting price action patterns, and analyzing candlestick formations, you can gain valuable insights into the market and viable trading opportunities.
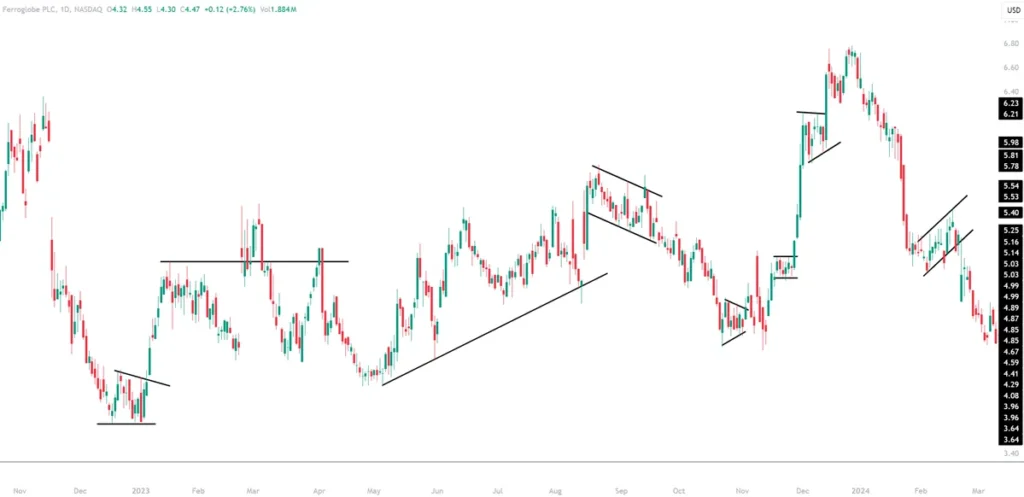
Market Trend Identification
Analyzing price swings is important for identifying market trends accurately. To recognize market trends effectively, focus on key indicators:
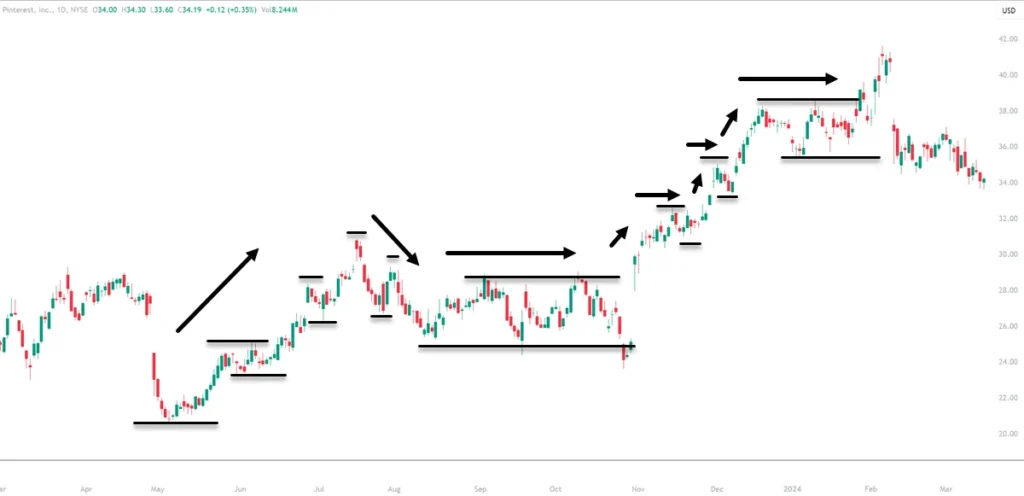
- Higher Highs and Higher Lows: In bullish trends, look for a series of higher peaks and higher troughs in price action, indicating an upward trend.
- Lower Highs and Lower Lows: Conversely, bearish trends display lower peaks and lower troughs, signaling a downward market direction.
- Trend Lines and Price Action Interaction: Utilize trend lines to connect swing pivots and analyze trend direction. Pay attention to how price interacts with these lines to make well-informed trading decisions.
Price Action Patterns
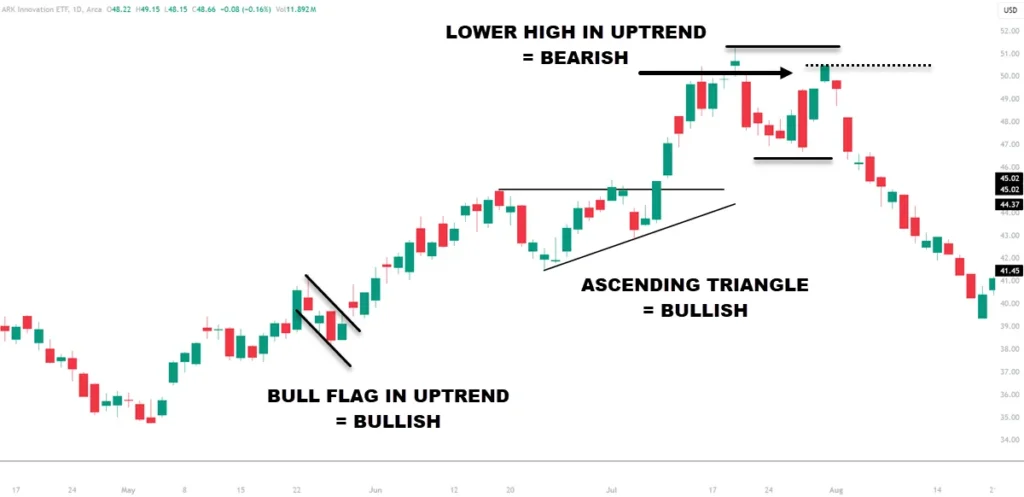
Price action patterns serve as valuable tools for traders to interpret and anticipate market behavior based on historical price movements. Understanding these patterns is essential for making informed trading decisions and identifying trade opportunities.
By learning price action patterns such as chart formations, traders gain insights into market structure and supply and demand. These patterns help traders predict future price movements and determine potential entry and exit points.
Incorporating a price action trading strategy into your approach can enhance your ability to analyze the market and improve your overall trading performance. Take the time to familiarize yourself with different price action patterns to sharpen your skills in recognizing and capitalizing on market trends.
Candlestick Analysis
Studying the patterns formed by candlesticks on price charts is important for understanding market behavior and predicting potential price movements. Here are some key points to keep in mind:
- Bullish and Bearish Sentiment: Certain candlestick patterns reveal whether the market sentiment is bullish (positive) or bearish (negative), guiding traders on potential price directions.
- Psychology: Understanding the psychology behind candlestick formations is essential. It helps in interpreting market dynamics and making trading decisions based on investor behavior.
- Reversal Points and Trend Continuations: Candlestick analysis aids in identifying reversal points where the market may change direction, as well as trend continuations, indicating where the market trend is likely to persist.
Trading With Price Action Patterns
When trading with price action patterns, focus on recognizing key candlestick formations that signal potential market movements. Price action patterns, such as pin bars, inside bars, and engulfing patterns, are essential tools for traders looking to interpret market conditions and make successful trades.
These formations help in determining entry and exit points, as well as setting stop-loss levels to manage risk effectively. To trade price action patterns successfully, it’s important to understand the context and location of these patterns within a chart.
Patience, discipline, and the ability to adapt to changing market conditions are important for an accurate interpretation of what you are seeing on the chart. By mastering the art of reading candlestick formations, traders can improve their trading strategies and their overall performance in the market.
Developing Good Trading Habits
To cultivate effective trading habits, consistency, and discipline play an essential role in executing trades successfully. Here are three key practices for price action traders to develop good habits:
- Setting Realistic Goals: Define clear objectives for each trade and overall trading performance. This helps you stay focused and motivated while ensuring your actions align with your long-term aspirations.
- Adhering to a Trading Plan: Create a well-thought-out trading plan that includes entry and exit strategies, risk management rules, and position sizing guidelines. Following this plan diligently promotes consistency and helps avoid impulsive decisions.
- Maintaining Emotional Control: Emotions can cloud judgment and lead to irrational choices. By keeping your emotions in check and approaching trades with a clear mind, you increase your chances of making logical decisions based on your trading plan.
Entry and Stop-loss Techniques
Emphasize the importance of precise entry and stop-loss techniques in your price action trading strategy to improve your risk management and trading effectiveness.
Entry logic in price action trading involves identifying high-probability setups based on market conditions and price patterns. By mastering entry strategies, you can capitalize on trends and make well-informed trades.
| Technique Type | Technique Description | Key Features |
|---|---|---|
| Entry | High-Probability Setups | Identifying patterns like pin bars, engulfing bars, or inside bars that indicate a potential trend reversal or continuation. |
| Entry | Trend Following | Entering trades in the direction of the prevailing trend when price action confirms the trend continuation (e.g., higher highs and higher lows in an uptrend). |
| Entry | Breakout Trading | Entering a trade when the price breaks through a significant level of support or resistance, often accompanied by increased volume. |
| Entry | Counter-Trend Trading | Identifying potential reversal points in a trend, such as double tops or bottoms, and entering trades in anticipation of a trend change. |
| Stop-Loss | Support and Resistance Levels | Placing stop-loss orders just below a support level in an uptrend or above a resistance level in a downtrend to limit potential losses. |
| Stop-Loss | Percentage-Based | Setting a stop-loss order at a predetermined percentage away from the entry point to manage risk exposure. |
| Stop-Loss | Volatility-Based | Using indicators like the Average True Range (ATR) to set stop-loss orders based on market volatility, allowing for normal price fluctuations. |
| Stop-Loss | Trailing Stops | Adjusting stop-loss orders as the trade moves in favor, locking in profits, and protecting against market reversals. |
Understanding stop-loss logic is equally important as it helps protect your risk capital. Price action traders place stop-loss orders based on support and resistance levels to mitigate potential losses in adverse market conditions. Logical stop-loss placements not only safeguard your trading capital but also ensure discipline and consistency in your approach.
By emphasizing entry and stop-loss logic in your trading plan, you can enhance your decision-making process and optimize your trading outcomes.
Trading Without Indicators
Trading solely based on price movements, rather than relying on traditional indicators, is a core principle of price action trading. When you Become a Price Action trader, use price action as your primary tool for decision-making.
Here’s why understanding price action is important for successful trading:
- Connecting Swing: Analyzing price changes and connecting swing highs and lows helps identify potential trend reversals or continuations.
- Start With Price Action: By focusing on price changes alone, you learn to read market sentiment and make trading decisions based on actual price movements.
- Real Trades: Trading without indicators allows you to take real trades based on what the market is doing, rather than relying on lagging indicators.
Summary
Becoming a price action trader involves mastering the art of reading pure price movements, identifying candlestick patterns, analyzing market behavior, and trading without indicators.
By developing good trading habits, emphasizing entry and stop-loss logic, and consistently applying price action patterns, you can enhance your trading skills and make informed decisions in the market.
Remember, practice and patience are key to mastering the nuances of price action trading. Keep learning, stay disciplined, and trust your analysis for successful trading outcomes.
FAQ
What is the Definition of Price Action in Trading?
Price action in trading refers to the analysis of basic price movements as a method for financial speculation. It involves studying historical prices to formulate technical trading strategies. Price action can be used as a stand-alone technique or in conjunction with an indicator.
How Can I Become Proficient in Price Action Trading?
To master price action trading, one should focus on learning to read and interpret various chart patterns and price movements. This involves consistent practice, studying historical price charts, and understanding market psychology. It’s also beneficial to combine theoretical knowledge with practical experience in live trading.
Is Price Action a Common Technique Among Professional Traders?
Yes, professional traders often use price action as it helps them to understand the underlying market sentiment and make informed decisions based on the actual price movements, rather than solely relying on technical indicators.
Which Technical Indicator Complements Price Action Trading the Best?
The Relative Strength Index (RSI) and Moving Averages are commonly used indicators that complement price action trading. They help in identifying trends and potential reversal points in conjunction with price action signals.
What is Considered the Most Effective Price Action Strategy?
The most successful price action strategy often involves the use of support and resistance levels, combined with the analysis of candlestick patterns and chart formations. This strategy requires a good understanding of market psychology and the ability to interpret subtle changes in price movement.
Can You Explain the 4-Hour Price Action Strategy?
The 4-hour price action strategy involves analyzing the price movements on a 4-hour chart timeframe. Traders look for specific patterns or trends that indicate potential entry and exit points. This strategy is popular for its balance between short-term and long-term trading signals, providing a comprehensive view of market trends.