- May 1, 2023
- Posted by: Shane Daly
- Categories: Trading Article, Trading Indicators

The best moving average for intraday trading depends on individual trading styles and preferences. The exponential moving average (EMA) is often used due to its ability to respond quickly to recent price changes, providing a more accurate view of current market trends.
![]() Are you looking to make the most of your intraday trading? Finding the best moving average for intraday trading is key. Knowing which type of Moving Average works best, and when to use it can be a game-changer in stock market success.
Are you looking to make the most of your intraday trading? Finding the best moving average for intraday trading is key. Knowing which type of Moving Average works best, and when to use it can be a game-changer in stock market success.
What Are Moving Averages?
Moving averages are one of the most commonly used technical indicators in stock trading. They provide traders with a simple way to identify trend direction and potential entry and exit points for trades.
The more common simple moving average is the average price over an extended period, generally 10 days, 20 days, 50 days or 200 days. The sum of closing prices over a certain period is divided by the number of intervals to to get this average price.
Short-term moving averages such as the 5 and 10 period are the most common with day trading strategies.
A long-term moving average can be useful intraday for traders wanting to keep the overall trend direction in mind.
To work out a 10-day moving average for Apple Inc., you would total the closing costs from day 1 to 10 and divide by the amount of periods (10). This will give you an average price for those ten days that can be used as a reference point when analyzing price movements in Apple’s stock.
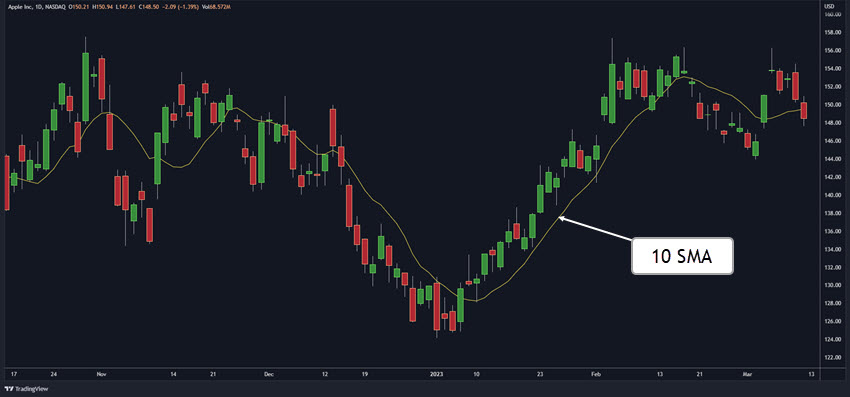
Analyzing Apple’s 10-day MA can quickly show the minor retracements in price were not enough to change the trend direction, which is to the upside, at this time.
SMA vs EMA For Intraday Trading
When it comes to analyzing stock trends, moving averages (MA) are a key indicator. MAs are used by traders to measure momentum and identify potential support and resistance levels.
SMA and EMA (exponential moving averages ) are the two main varieties of MA that traders use to assess momentum, identify potential support/resistance levels. Both can be useful in different ways, so let’s take a look at the differences between them.
The SMA is calculated by taking the average price over a set period of time. To calculate a 10 SMA on a 5 minute chart, you would need to sum up all of the closing closing prices over the last 50 minutes and divide by 10.
SMAs don’t give more weight to recent data points; instead they equally weigh each day’s close price when calculating the average. This makes SMAs slower than EMAs because they lag slightly behind current market conditions because all past data is equal.
For short-term trading strategies such as scalping or day trading stocks EMAs may be more advantageous than SMAs due to their ability to react faster to new information. This is because they give greater weighting to recent values compared with older ones.
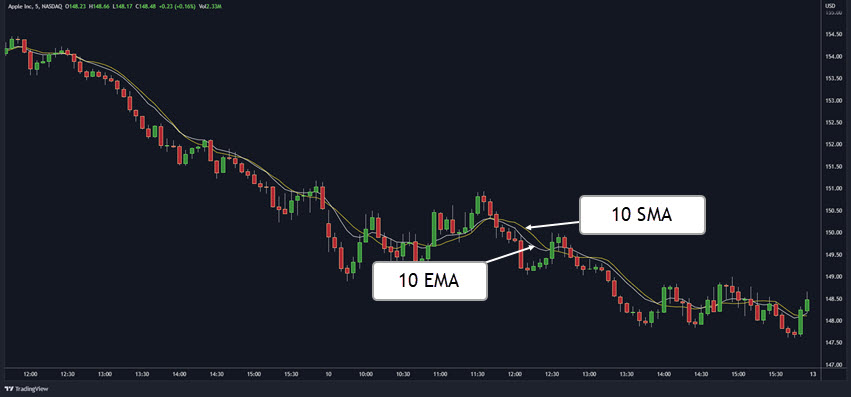
You are looking at a 5 minute chart using both 10 EMA and 10 SMA. Is there a difference that will make or break your trading strategies? Do they represent the price trend differently?
Which Time Frames To Watch While Day Trading Stocks
Knowing which time frames to watch is essential for any trader looking to make profits in the stock market.
Traders can use a range of timelines, each having its own pros and cons that need to be considered before settling on the best option. Traders should evaluate the benefits and drawbacks of each chart type to determine which one is most suitable for their trading strategy.
The most common time frame used by day traders is the 15 minute chart.
This chart offers a blend of short-term price activity and filtering out some market noise. The 15 minute timeframe allows traders to quickly spot opportunities while still providing enough information about longer term trends if the overall goal is trend direction trading.
Another popular option among intra-day traders is the 5 minute chart. This timeframe is great for spotting quick changes in price action and for entering breakout style trades including opening range breakouts.
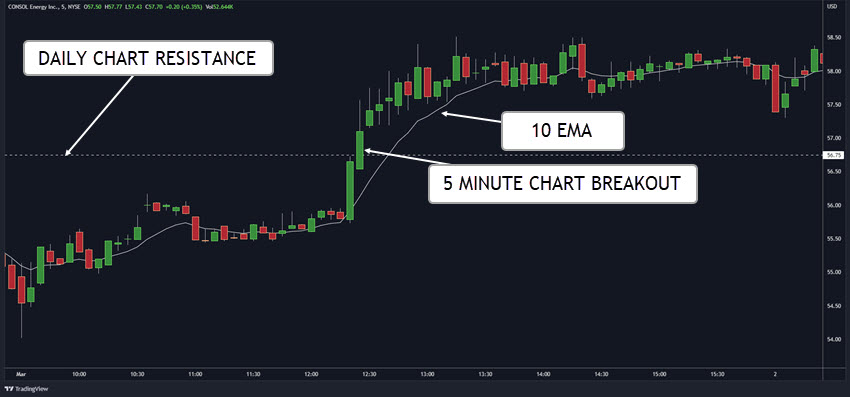
This shorter timeframe means there will be more noise in your data than with a 15 minute chart, making it harder to identify true signals from false ones without additional analysis tools like volume indicators or moving averages (MAs).
For those just starting out day trading stocks, it is recommended you focus attention on 15 minute charts until becoming comfortable reading other types of technical analysis tools such as RSI, MACD etc.
Best Average for 15 Minute Charts
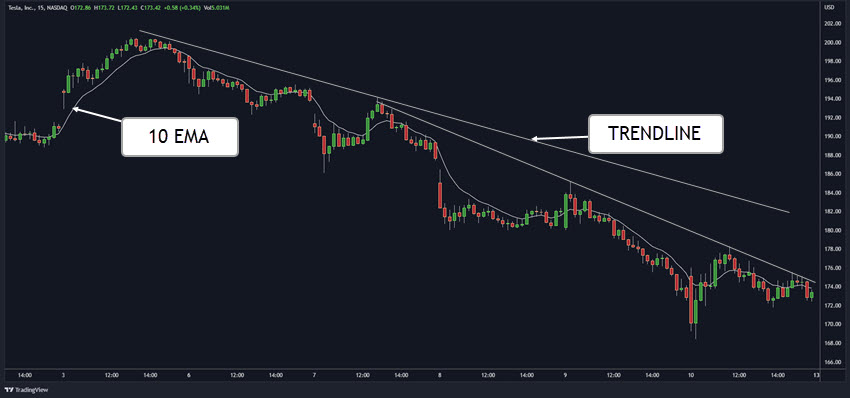
The best average for intraday trading on the 15 minute chart is any shorter moving average like the 10 EMA.
One way to use EMAs for day trading stocks is by combining them with other indicators such as MACD or RSI. For a better understanding of the market’s direction, one can observe multiple time frames to gain insight. To gain an overall trend perspective, you could examine multiple time frames such as 30-minute and 1-hour charts.
Using a 10 EMA for day trading stocks provides traders with greater insight into recent price data due to being a faster average and using past price data over the last 10 periods.
By combining various indicators such as MACD or RSI along with different time frames like 30 minutes/1 hour, traders can gain valuable information about where the markets may go next; making their trading decisions a little less random.
The 15-minute chart is a great tool for intraday traders looking to identify trends and make profitable trades. Combining moving averages with other indicators can further refine your trading strategy, allowing you to capitalize on market movements more accurately.
Combining Averages with Other Indicators
When it comes to technical analysis, combining different types of moving averages with other indicators can be a powerful tool for day traders. Moving averages are a good way to guage the direction and momentum of stocks, but they may not always give sufficient information on their own.
By adding additional indicators such as RSI (Relative Strength Index), MACD (Moving Average Convergence Divergence) or Stochastics, they can help you make trading decisions based on more information than a moving average can give.
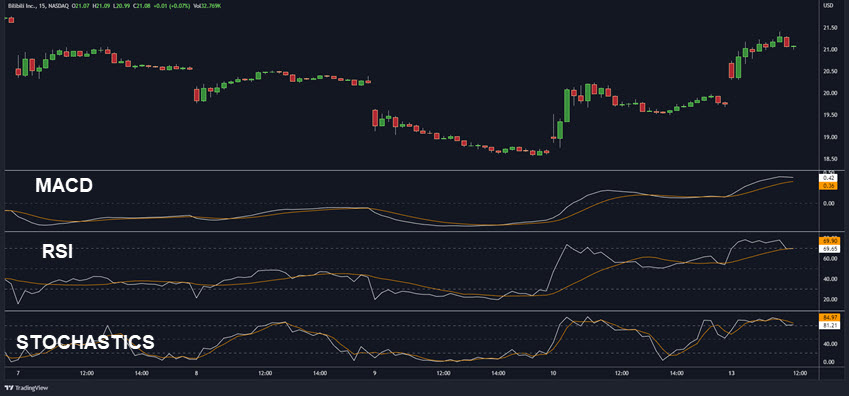
RSI gauges the intensity of price fluctuations in correlation to past values over a specific period. It helps identify when stocks may be overbought or oversold which could indicate a price reversal. When used together with moving averages, traders can look for divergences between the two which could indicate potential reversal points in the market.
MACD is another popular momentum indicator used in conjunction with moving averages to help identify trends and trading opportunities in stocks and other markets. The MACD line shows how far away two moving average lines are from each other which is interpreted as how much momentum is in play.
Stochastics is a useful indicator to help determine the current price cycle in the instrument. This is also used to gauge momentum by the hooking of the fast line across the slow line.
Using other indicators alongside moving averages for intraday trading provides day traders with greater insight into potential trade opportunities.
The 5, 8, 13 Strategy
The 5 8 13 EMA strategy is perfect for those who like using moving average crossovers. It’s using the faster EMA moving averages which allows more opportunity for trades.
The short-term EMA should have a period of five periods while the longer SMA should have be eight and thirteen periods respectively.
By comparing these 3 averages, traders see which direction to trade as well as when to enter or exit trades. Traders may also use other indicators/price structure such as support/resistance levels or trend lines on their charts to confirm any signals they receive from the 5/8/13 setup.
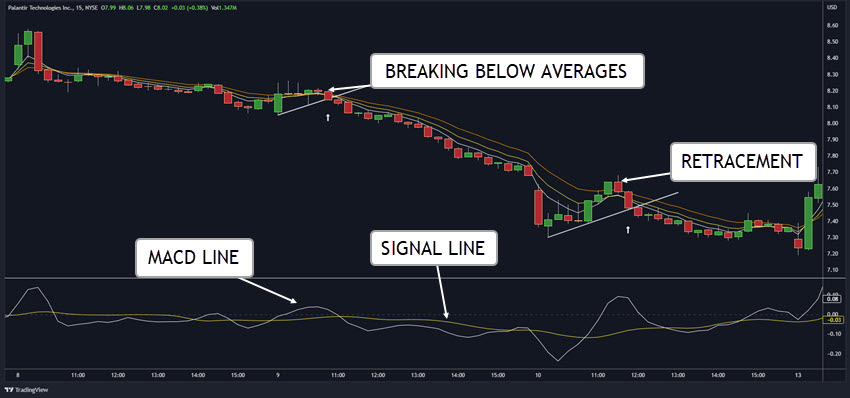
This chart shows the addition of the MACD 3 10 16 SMA settings to aid in confirming momentum of price.
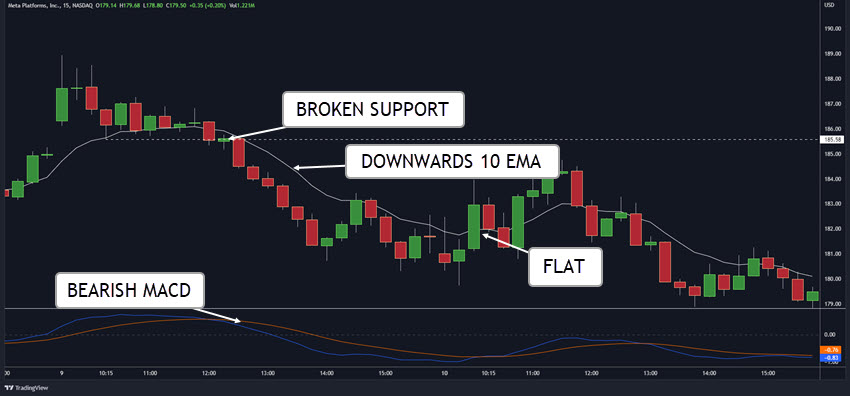
When price breaks below all of the moving averages and the MACD line begins to hook to the downside showing the momentum direction, we have a sell signal. Price can be either on the trend line or breaking below it for further short trade confirmation.
You do want to see the 5 EMA below or at the same price point as the 8 EMA when selling. Having the longer moving average in the same direction is a good signal to look for. Flat is also fine but we don’t want to see it in the opposite direction.
When intraday trading with moving averages, you must understand there is a lag between indicators and recent price action . Both of the trades above are showing strong bearish candlesticks which shows sellers are taking over.
If the MACD signal line is trending in the opposite direction, ensure you have a conservative profit taking strategy as the move may be short lived.
Here is a five minute chart showing a perfect setup to the upside:
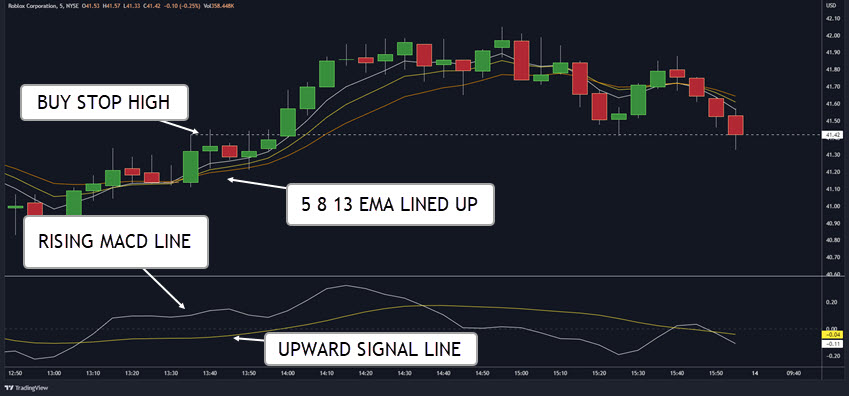
Stop loss levels on buys can go below the entry candles and for sells, go above the candle.
This strategy may not always be reliable, as markets can often move against a confirmed trend. Traders who use this approach should make sure they place stop losses appropriately so they don’t take too large of losses when the trade turns against them.
Best Moving Average for Intraday Trading FAQs
What is the best moving average for intraday trading?
The best moving average for intraday trading depends on the trader’s goals and preferences. Traders look for a combination of short-term (5 to 20 periods) and long-term (50 to 200 periods) moving averages that are often used in volatile markets. The shorter term moving averages are used to identify short-term trends while the longer ones help determine overall market direction.
What are the most popular moving averages for day trading?
The 3 most commonly-used moving averages for day trading are the SMA, EMA and WMA. The SMA is calculated by taking the average of all closing prices over a certain period of time. The EMA gives more weight to recent data points and is more receptive to recent price change, while WMA assigns different weights to each data point in order to reduce noise and create smoother trends.
How to use 5 8 13 EMA?
The 5 8 13 exponential moving average (EMA) is a group of moving averages used by traders as a trading strategy. When all three EMAs are pointing up, it indicates that an uptrend is likely. If they are all heading down then a downtrend could be the direction. Traders can also look for divergences between price action and the EMA lines which may indicate potential reversal points in the market.
Conclusion
When it comes to the best moving average for intraday trading, traders should consider using a combination of SMA and EMA, short term setting such as 5 and 10 along with other indicators such as MACD or RSI. The 5-8-13 strategy is also an effective way to trade stocks on 15 minute charts. With practice and patience, day traders can use these strategies to maximize their profits in the stock market.
Stop Guessing. Start Trading With Confidence!
Download the Free Trading Indicator Blueprint now to learn the truth about indicators,
Moving Averages, Keltner Channels, Stochastics, MACD and more.
Most people charge $97 for a course like this – but today you can get it free!