- April 20, 2023
- Posted by: CoachShane
- Categories: Trading Article, Trading Indicators

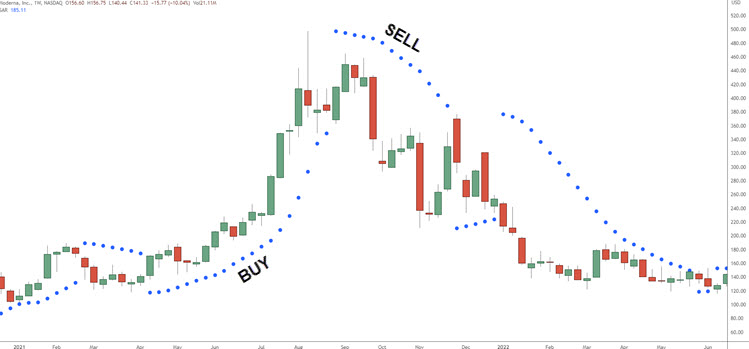
The Parabolic SAR (Stop and Reverse) is a technical indicator that helps traders identify potential trend reversals in the market.
To use it effectively, you should use it in combination in a trading strategy with other indicators and established clear entry and exit points based on its signals.
What Is The Parabolic Sar?
The Parabolic Sar (stop and reverse indicator) by J. Welles Wilder, is a trading indicator that can be used for a few purposes:
- Trend determination
- Trade entry signals
- Exit signals
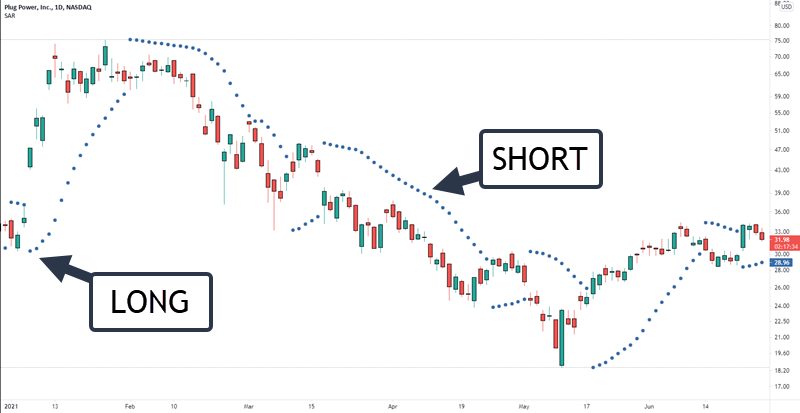
The “stop and reverse” feature as shown by a series of dots above and below price, is designed for traders that are always either long or short in the market.
1. If the Parabolic Sar is plotting dots below price, Wilder considered price to be in an uptrend
2. If plotting above price, we will consider the price is in a down trend
How Is The Parabolic Sar Calculated?
Using the most extreme price value, the PS uses the following calculation to plot:
The calculation is: SARn+1= SARn + α(EP – SARn)
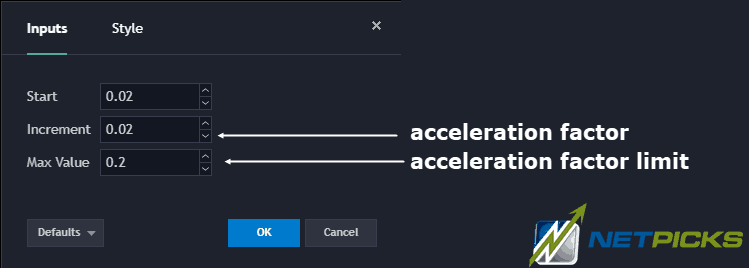
| Parabolic SAR Settings | Explanation |
|---|---|
| Start Value | This is where the acceleration factor will start at, which is typically set at 0.02. |
| Acceleration Factor | This value determines how much the original value will increase each time a new high/low in the trend is plotted. |
| Max Value | The maximum value sets a limit on how much the acceleration factor can increase, helping to prevent it from growing too large. |
When prices begin to move with larger price jumps, the Parabolic Sar begins to plot on a more extreme curve angle as you see on the last up move on the chart above.
Best Setting
A common question about any trading indicator is what the best setting is.
The fact is there is no general best setting but there can be a best setting for each trader.
- If you set the acceleration factor too high, the dots will come closer to the price action and you will get quicker buy and sell signals.
- Quicker signals can equal more whipsaw which is something we do not want as a trader.
I always suggest starting with the default setting and if you feel the need to adjust, start from there.
Best Used During A Trend
Trending markets are best for this indicator. There are other indicator options for market in a trading range – think oscillators.
The PS is a much better trading indicator when used in strong trends as opposed to whipsawing price action where many “false signals” will happen.
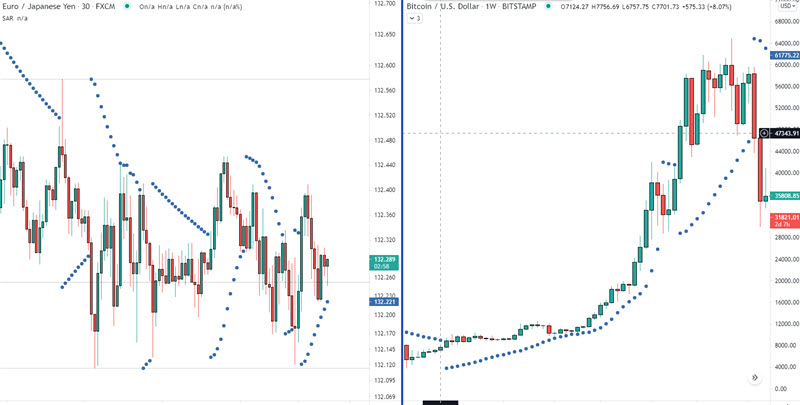
Using the indicator for trend direction may not be the best use of it. You can look on the chart on the left and see that the trading conditions are not a great as on the one on the right.
How to Trade Using the Parabolic SAR Indicator
The common approach when using the PS for trading signals is trade when the indicator dots break.
For example, when the dots flip from the top to the bottom of the price chart, you’d exit any short trades and flip to longs.
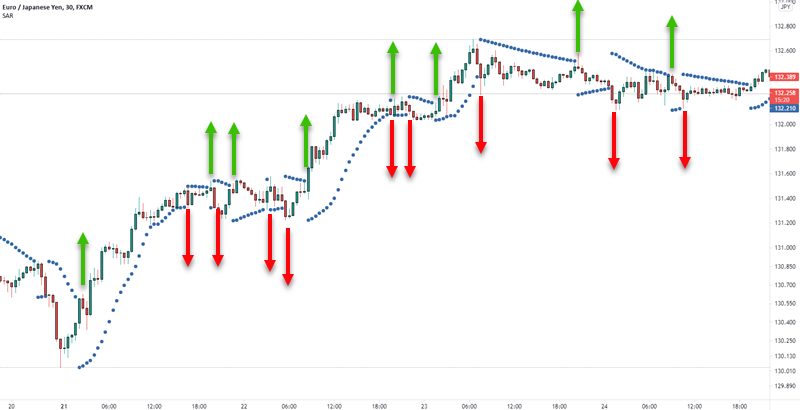 It’s easy to see that when the trend is running, buying or selling the flips works well.
Once we get into back and forth action with the price bars, taking positions can be a painful losing experience.
Using the indicator for buy and sell signals will not be a successful approach if you are blindly taking those trades. We will examine one adjustment we can make to better filter out the trades to take. All trader may want to incorporate other technical analysis tools before entering a trade.
Protective Stop Loss Location
Using the indicator for your stop loss for losing trades or as a trailing stop, may have some merit.
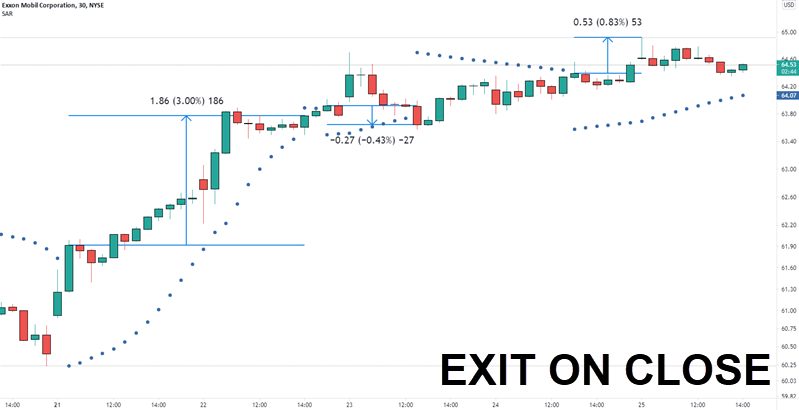
This is an example of simply exiting a long trade on the candle close after the Parabolic Sar flips to the downside.
The danger of this method is the candle that closes that confirms the flip, may have been a larger than normal average true range. It could turn a winning trade into a loser.
Trailing Stop Loss
Another method, my preferred method, is to use it as a trailing stop feature.
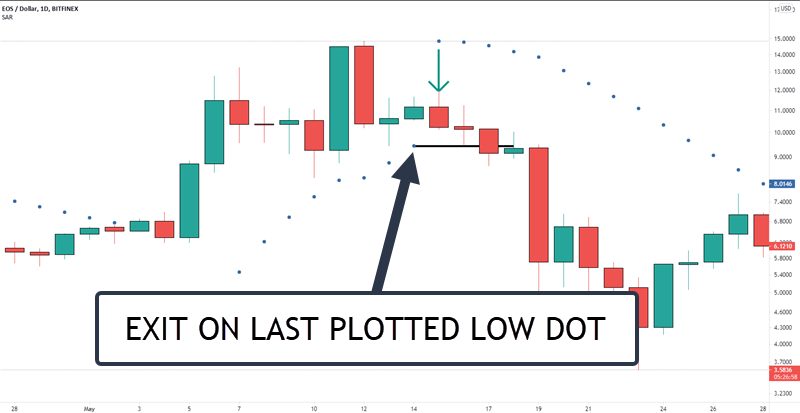 Traders would trail their stop up on each plotted dot. While this example would have had you out later than the “flip exit method”, you don’t have the risk of giving back too much if a momentum downside candlestick steps in.
Another bonus is you would only check in with the market at the end of every candle close to adjust your stop. For some, that may be every 5 minutes. For others, once a week
Parabolic Sar Trading Strategy (Breakout)
Whenever the Parabolic SAR switches to the opposite side of the price, this could be interpreted as a potential trend reversal or a break in the trend. We can consider this as a pullback.
In a pullback, you get a high and then lower prices. The swing high can be considered a resistance zone. If you were to enter a trade long by only using the flip of the indicator dots, you could be running into resistance.
We need a breakout of resistance in order to enter the position.
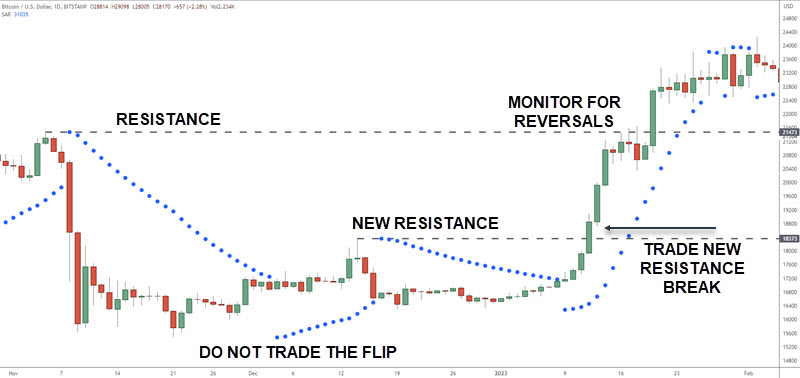 In this strategy, we will mark the first extreme point as initial resistance. Price retraces and eventually get a flip of the SAR dots. We do not trade this flip but it gives us a new resistance zone when price pulls back again.
Price breaks the lower resistance, the zone, and since the PSAR is in our direction, we enter the trade. You want to monitor the higher resistance zone for price action reversals.
Stop Loss: Traders can place the stop loss under the candle that turned the PSAR indicator, under the entry candlestick or under the most recent swing low.
Can A Moving Average Give Better Results?
Maybe.
While trading counter trend can be done, there are specific times to do so and for most traders, following the longer term trend is a better way to trade.
Using a moving average as a trend indicator to show the current trend direction and only taking buy and sell signals from the Parabolic SAR, will likely produce better results.
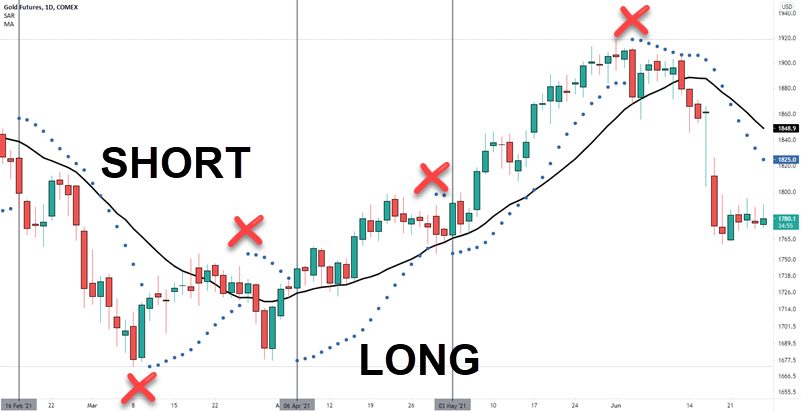
I am using a 20 period simple moving average in this Gold futures example and feel free to use any length depending on your trading goals.
Trade Direction – Moving Average Trend
There are two main ways to define the overall trend direction when using a moving average:
- Price is below the average for short and above for longs
- Slope of the moving average
In our example, there are five Parabolic Sar flips that were ignored as the moving average did not confirm the direction, which in this case is price over or under the average.
The one issue that is apparent is that the flip can happen when price is extended far from the moving average as you see on the left.
What can we do to ensure we have an objective way to recognize price that may be looking to reverse?
Using Keltner Channels And Parabolic Sar
On this chart is the 20 period Keltner with bands set at 2.25.
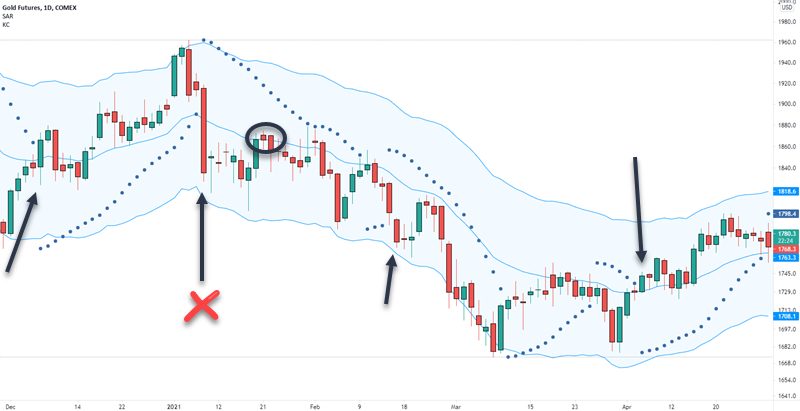
If you see price has extended close the upper or lower band, you’d ignore the first signal and wait for price to pull back to around the moving average on the channel
The red X shows price below the average and the PS dot on top. This would be a short trade however price movement has driven to the low of the channel.
Expecting a retrace, you’d not enter the trade and wait for a better entry.
You now need to define a “better entry”.
Look to enter a trade when price touches the average.
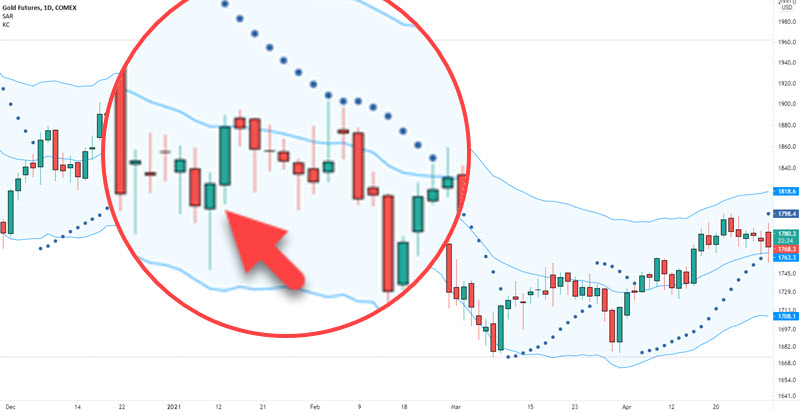 This is the same chart and price pulls back to touch the average for a potential short trade.
You would place a sell stop order below the low of the candlestick and wait for the potential reversal and trigger.
Aggressive traders may decide to trail the entry up which may get you in earlier depending on your stop loss location.
Dynamic Support And Resistance – It’s an Illusion
Some people attempt to sell traders on the idea that moving averages, bands, and even the Parabolic SAR act as “dynamic” support and resistance. They don’t.
When you see price seemingly act as support or resistance, what you are seeing is the result of a mathematical calculation using a variation of open, high, low, close or one of them. If the close, for an example, of price is roughly the same due to a trading range, the moving average will catch up to price.
While it may appear to be acting as a barrier to price, it isn’t. Once you accept that, you may find yourself having a different feeling towards risk management and actual price structure.
FAQS
What are the best markets for a parabolic SAR strategy?
The best markets for the parabolic SAR are ones with a steady trend in either direction. Do not use it in a sideways market.
What indicators should I use with it?
Consider adding in a moving average for trend or the Keltner Channel to avoid trading extreme price bars
What are the best ways to use the SAR for stops?
The best way to use the SAR for stop loss is to ensure you use a buffer to avoid fake outs.
Conclusion: A Viable Trading Indicator?
There are some things to like about the indicator especially that it keeps you objective in terms of trade entries.
Using the acceleration factor can help you lock in profits when the trading signal you took is moving in your direction. There is no guesswork involved. If you are thinking of tweaking the settings, often times the default settings are good enough.
There may be other technical indicators and tools like candlestick patterns and support and resistance zones that may prove useful for you strategy.
Using a moving average as a trend determination can keep you from getting whipsawed as you will cut down on the buy/sell signals that are plotted.
The Keltner Channel is a great addition when using the buy signals and sell signals of the Parabolic Sar.
Updated: April 2023
Published: Feb 2022

