- August 13, 2017
- Posted by: Shane Daly
- Categories: Trading Article, Trading Tutorials, trading videos
Trading indicators as a form of technical analysis are an important part of the trading system and strategy of many traders. Whether traders are looking for a way to determine a trend or a buy/sell signal, technical indicators are the first line of offense that they use.
I know we hear that a trading indicator is a crutch but in reality, there is nothing inherently wrong with a trading indicator. It is simply a tool that can be used to frame price and help a trader better understand what they are looking at.
You may not want to trading an indicator alone though. You won’t get a complete picture of the market if you only focus on the indicator and I will show you below how price action can make you a more complete trader.
Indicators Analyze Past Data
Trading indicators lag price because they are a derivative of price (unless you are using a trading indicator based on volume) but they are used by traders to interpret what price has done and what price will potentially do.
That is not a big deal and those people that bash indicators and ramble on about the lagging nature of indicators have their own agenda. You don’t NEED to pick a bottom or a top and many traders make their money during the meat of the move.
- Getting in the market may be later than buying or selling at the extremes but that is not a big deal.
- Getting out of the market while waiting for an indicator to give you the nod may cost you though.
The bottom line is the the purpose of a trading indicator is to help determine a trading opportunity, a lack of a trade entry, and when to exit your trading position.
Chart First. Trading Indicators Second.
I tell people I speak with to use what the chart shows you first and indicators second. I am going to point out two ideas but don’t think that is all there is. I could write a book….or three….on usage of indicators of all types.
For now, I will stick with two ideas.
Let’s consider using the moving average trading indicator for trend determination which is what many traders use them for.
At a glance, you know if the market is up or down according to what you determine accurately shows the current trend on the time frame you are looking at.
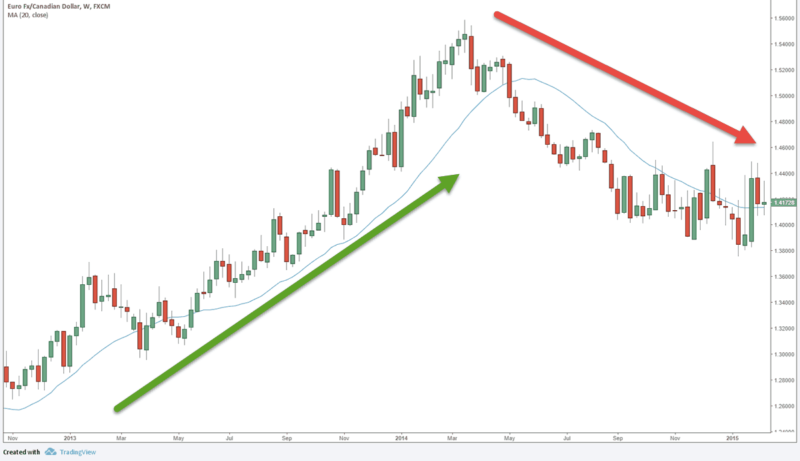
Here we have a 20 period simple moving average that can show trend in a few ways.
- If price is trading above it, we look for longs.
- Trading below it calls for shorting opportunities to be hunted.
Not shown on the chart but if price is crossing back and forth over the moving average, chances are you are in a consolidation and would not take any trades depending on your trading system.
Our trading tips blog has an article on two trading indicators you can use to determine a market in chop called the Bollinger Band Squeeze instead of using the moving average.
You can also use two moving averages and the crossover would highlight a pending trend change if you need a little more confirmation and objectivity in your trading.
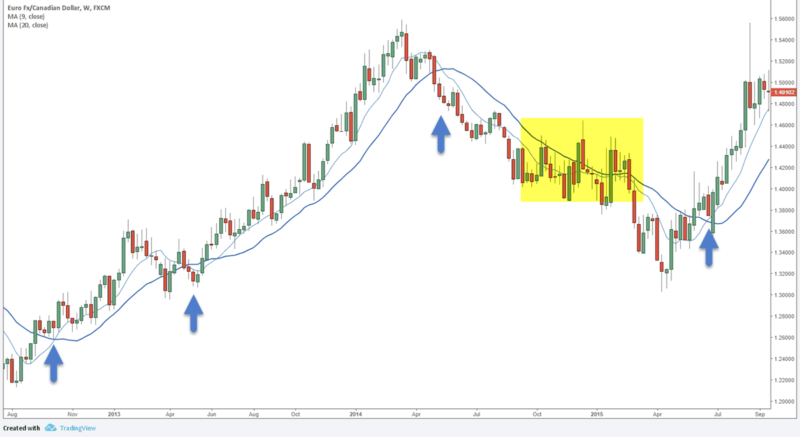
These are the 9 and 20 simple moving averages and I’ve placed arrows where the crosses occur. You’d be looking for longs when the thin line crosses to the upside of the thick line and shorts when it crosses below the thick line.
I’ve also placed a yellow box where you will see the two moving averages converge. This indicates the potential of a consolidation and you may opt to play a breakout from this zone.
Price Action Trading With Moving Averages
You could play each and every cross of the moving average but trading is not that simple. You can use the information a technical indicator gives you along with basic price action trading knowledge to start to form a workable trading strategy for yourself.
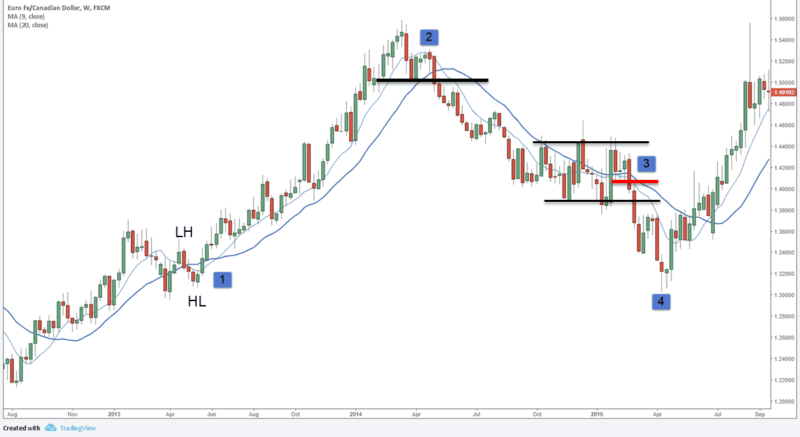
This is the same 9/20 moving average chart from before but we are looking at some basic price action in relation to the trading indicators.
- We’ve crossed to the downside but price action has not registered a lower low after the lower high (LH). We would not be looking for shorts even though the moving average has told us to either short the cross or trade a pullback to go short. Reading price action allows us to ignore the lagging indicator and save ourselves a potential losing trade.
- Price action is showing low momentum into the peak and we can short a break of support before the moving average crosses to the downside. If you were waiting to trade a rally short after the moving average crossover, it takes almost two weeks before we trade into the 9/20 trading zone.
- While the moving averages converge, we can already see signs of consolidation after the shadow puts in a higher high preventing a short trade. The red line indicates a smaller range inside the larger range and a break of the smaller trading range front runs the larger break.
- An obvious reversal candlestick that pushes into support from the left of the chart. The inside bar that follows could indicate a long trade (depending on your trading strategy) long before the moving averages cross over.
You can see that using a technical indicator combined with price action offers a more complete way of approaching your trading charts. With that, you hope your probability of trading success in the long term increases and you begin to take trades that have a higher odds of giving you some traction into positive territory.
Trading Indicators Are Not A Complete Package
Indicators can offer us an objective look at the market and for most of us, that can keep us from doing stupid things.
But you can’t trade them in a vacuum.
Even though our trading systems use trading indicators to frame your trading opportunities, the trading plans provided hit home the importance of trading adjustments around structures such as support and resistance.
You’ve seen how using simple trend structure can keep you from blindly shorting a Forex pair giving you a losing trade. You’ve seen how price action showed you a consolidation which stopped you from taking a pullback trade to the downside.
Don’t underestimate the power of combining a lagging technical indicator with the present price action. It can save you some grief and offer up stronger trading opportunities.
