- December 4, 2019
- Posted by: Shane Daly
- Category: Trading Article

The Ichimoku indicator is a powerful indicator that shows the momentum and trend strength, and possible support and resistance levels of an asset.
Ichimoku uses five moving averages and part of the calculation produces a cloud that represents potential future support and resistance areas.
- 2 of the moving averages compute the cloud
- The Ichimoku settings are a 9-period moving average, 26-period average, an average of those two averages, and a 52-period average
- The cloud is potential support and resistance zones and when below the price, we have an uptrend. When the cloud is above price, we are in a downtrend
Before learning how to trade the Ichimoku indicator, you should understand what these lines actually mean.
The Lines Of The Ichimoku Indicator
As mentioned, the lines of the indicator are moving averages that have specific functions on the chart.
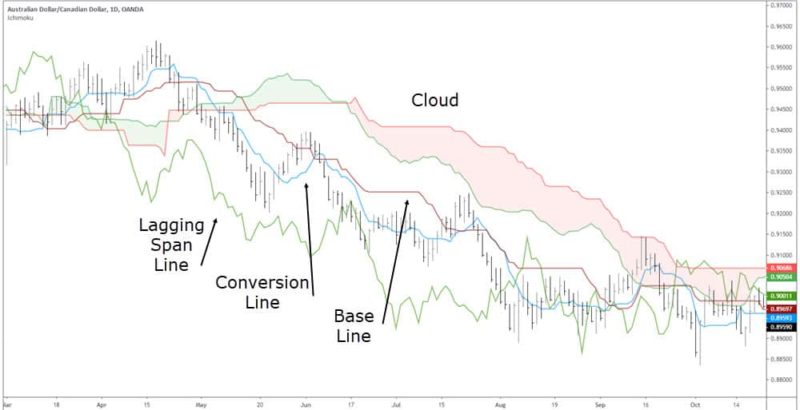
For our purposes, we are not going to cover the lagging span line ( Chikou Span ) which plots the closing prices of the previous 26 periods. This would be beneficial for traders who want to compare previous price trends with the current trend.
Conversion and Base Lines
These 2 lines represent the present time where:
- Conversion Line (Tenkan Sen) shows the middle price of the previous 9 periods high and low
- Base Line (Kijun Sen) represents the middle price of the previous 26 periods high and low
Both the conversion and the base line are analyzed just like any other moving average. For those that believe moving averages act as support and resistance, they are considered as such. The crossing of the averages and price relation to the averages represent a trend and momentum in the market.
- Both base and conversion lines are considered as support and resistance
- The crossing of the averages indicate momentum and space between line can gauge momentum strength
- Price trading above both lines is an uptrend
- Price below the line is a downtrend
You can see that the Ichimoku is not as intimidating as it looks.
How Does The Ichimoku Cloud Work
This is the most recognizable part of the trading indicator and comprises a fast line, a slow line, and a shaded middle.
- The fast line is the middle price that is calculated using the conversion and base line
- The slow line is the middle price of the 52 periods high and low
- These calculations are shifted 26 periods into the future. (think of how displaced moving averages are in the future)
The cloud will show us the longer-term trend direction as well as potential support and resistance zones.
You can see a red cloud indicates a confirmed bearish trend while a green cloud indicates a confirmed bullish trend. You would only take trades in the direction of the cloud if you are primarily a trend following trader.
- Prices above the cloud would only have you exposed in long trading positions
- Prices trading below the cloud would have you in bearish trading positions
The crossings of the conversion and base line indicate momentum direction at times against the cloud trend direction.
How To Setup The Ichimoku Cloud
I use Tradingview however many charting platforms will have the indicator as part of the package.
You apply the indicator to the chart, in the same manner, you would any other technical analysis tool.
Once applied to the chart, you can alter the settings although whether you trade Forex, cryptocurrencies, futures, or stocks, often times the default settings are acceptable.
How To Trade Using Ichimoku Cloud
Now that you understand the building blocks of the indicator, you should have a fairly good idea on how to trade with it.
Pick Your Bias
Since the cloud is the first thing people notice, start with that.
Remember, a price above the cloud is bullish, the price below the cloud is bearish, and the color confirms the bias
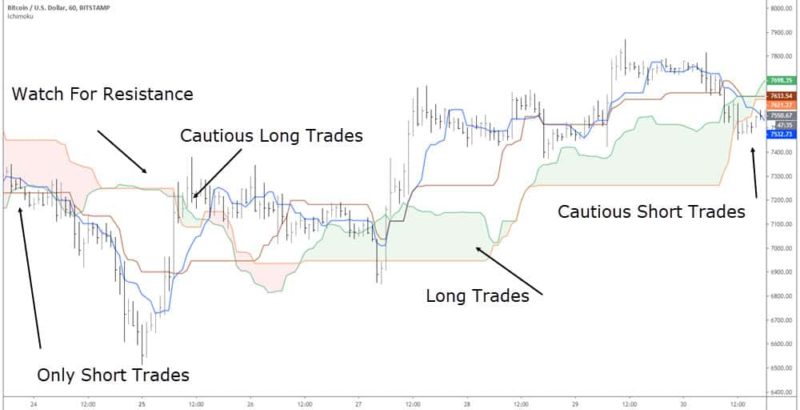
This is a day trading chart of the cryptocurrency Bitcoin using the standard settings. At any time, you can glance at the chart and know exactly what strategy to implement and the direction to trade. This is an objective way to determine where you will risk your money.
For cautious trades, you may consider using half of your usual risk percentage until confirmation of the trend has been shown.
Use The Conversion and Base line for Momentum direction
Momentum and trend are different things and conservative traders may only trade when the momentum is in the direction of the overall trend.
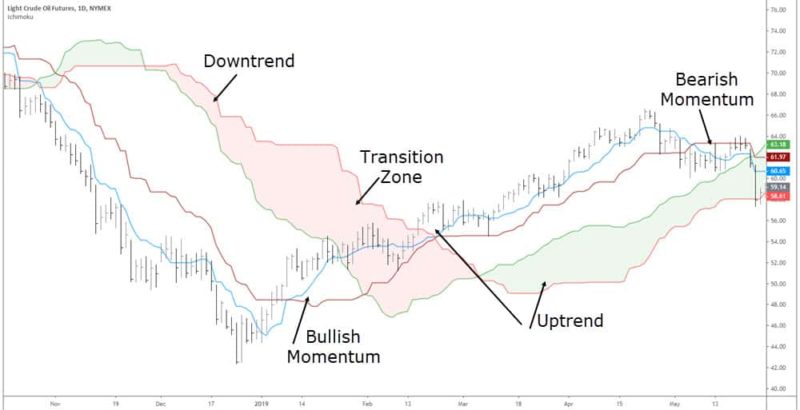
Let’s break down a Forex swing trading chart on the daily time frame and show potential trading signals depending on your plan.
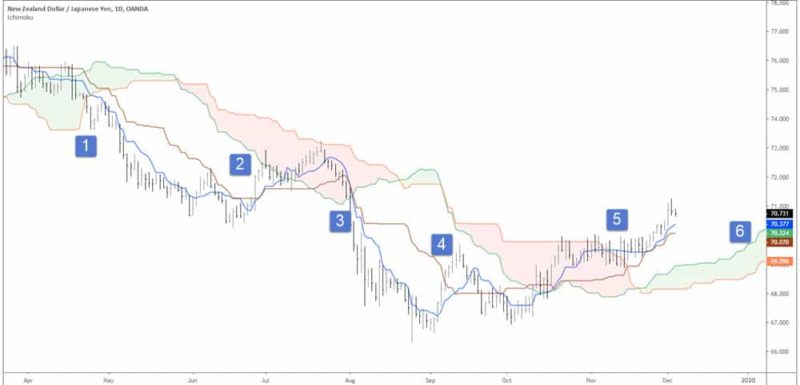
- The lines have crossed and the price is on the bottom side of the lines. This indicates bearish momentum and could be a trade entry
- Momentum turns bullish and price enters the cloud which signifies a possible transition period. Trades may be exited here as you could be seeing a trend reversal
- Momentum turns back to the downside, price is below the conversion and base line and has broken to the downside from the cloud. Short entry
- Bullish momentum and reading price action would show higher lows being put in – bullish
- Momentum is up, price breaks the top of the cloud for lower risk profile trade for this bullish signal
- Possible potential support zone
Aggressive traders may take long trades while the cloud is still red in color. A more conservative trading approach is to wait until the cloud is green for longs and wait for pullbacks in price.
Where To Set Stops And Targets
Before entering a trade, you must define the risk you will are willing to take. While I prefer using the ATR for my stops, let’s consider our initial stop loss using the Ichimoku indicator.
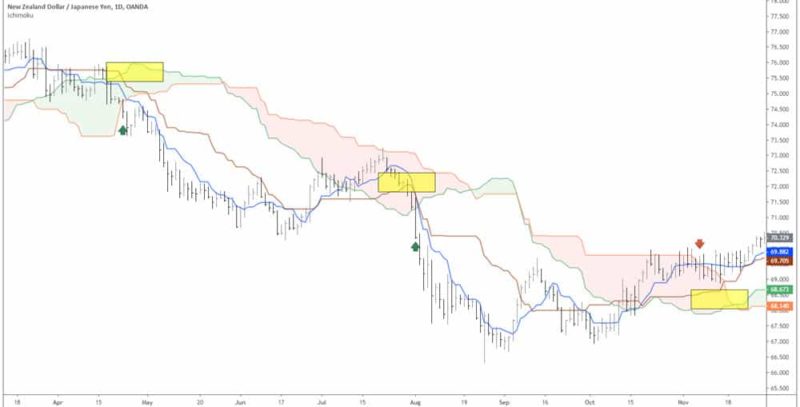
The first short trade on the left would have the stop loss location around the top border of the cloud. This is possible due to the contraction of the cloud in that area. If it were too wide, our position size may be too small or we would not have the capital required for the trade.
The second location is using the high of the base line as it may act as potential resistance if price retraces.
The last location is below the baseline as well.
Profit Targets
If you are a trend follower, you won’t have a profit target because you are trading until you see a transition of the trend direction.
Understanding that you may hold a trade until price retraces back inside the cloud as that show a possible trend change is forming.
If your trading plan includes always being in the market, you would exit a short trade and enter a long trade when price breaks the top of the cloud.
Short term traders may decide to use price structure such as previous lows and highs or a multiple of their risk.
The Ichimoku Indicator Is Worth Considering
If you believe an objective approach to trading will help you stick to your trading rules, the Ichimoku is not a bad option.
- The visual nature of the cloud tells you at a glance the bias you should have in the market
- The conversion and base lines will show you the short term momentum for and against the longer-term trend direction
- You have several take profit options including an “always in” trading approach
As with all trading systems and strategies, ensure you do proper testing, use a written trading plan, and understand the risks involved.