- October 4, 2021
- Posted by: Shane Daly
- Category: Trading Article
In a busy world, not everybody has a chance to sit and trade all day.
In fact, one of the reasons our Options trading programs have done so well is because of time constraints. To learn about Options trading, shoot Mike an email: mike@netpicks.com and let him know you are interested in learning about what Netpicks has for Options traders.
One thing everybody has time for though is to:
- Look at a daily chart
- Find a specific candlestick
- Use a lower time frame for a potential trade entry
Let’s look at a swing trading strategy that anybody, regardless of your work schedule, could make use of.
How To Set Up This Strategy
First thing is to open up a daily chart of any instrument. From stocks to cryptocurrency, most anything you are interested in trading can be used.
I am using the charts from Tradingview for all these examples.
Before I pick the stock, I will use this website to see which sector is doing well. I will then look for a stock inside of the best sector.
For these examples, I will be looking at energy stocks.
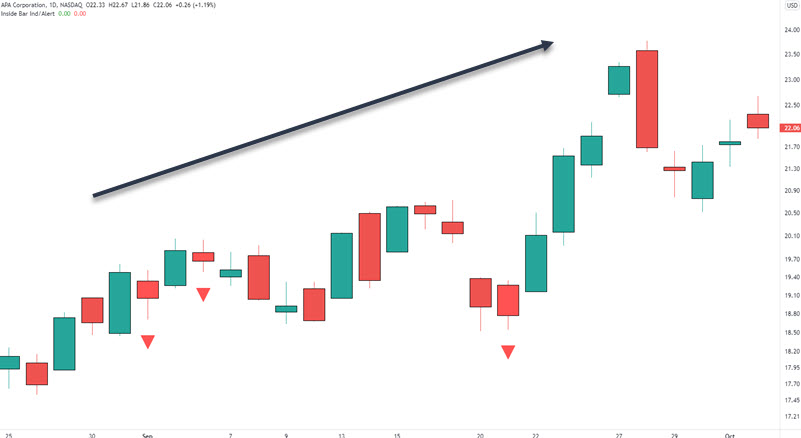
On this chart, you can see that the overall price trend is up. We don’t need a trading indicator as we can see the stock making higher highs and higher lows. That defines an up trending instrument.
Next thing we need to find is an inside bar.
An inside bar is simply a consolidation (trading range) on a lower time frame.
Inside Bars
Notice the triangles below some of the candlesticks on the chart. That is a free indicator you can find inside the public library at Tradingview.

Trading with inside bars is an underrated approach to the markets. Make sure you read my article “Inside Bar Breakout Trading Strategy” to see a very interesting approach to profiting from this type of candlestick.
Now that you see you have an inside candlestick, we are looking for price to break from it.
In order to see that occur, we are going to use a lower time frame. You can use a 1 hour or 30 minute chart.
Lower Time Frame Chart
This is a one hour chart and I have highlighted with the 2 horizontal black lines where the inside bar is.
I have drawn a standard trend line on the highs of the candlesticks.

The market gapped up over the trendline on the open the next trading day.
A buy stop order is place above the high of the one hour candlestick and if price continues, it will bring you into the trade.
Once you draw the trend line, considering setting an alert for when it breaks. This way, you don’t need to sit and watch the trading charts.
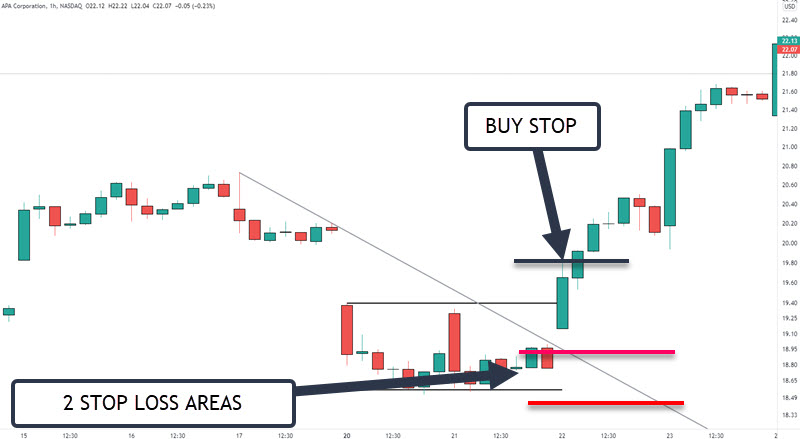
Your stop loss order can be placed under the entry candlestick or, depending on distance, around the lows of the inside day. The gap in this case causes too large a distance, for me, to use the low of the inside bar. Obviously a no gap move is preferred.
Taking Profits
There are times when this can run in a trend so having a trailing stop can make sense.
Some traders would rather use price structures such as previous swing highs. Others make want to scale out when price advances in terms of risk : reward ratios. Scaling out at 1, 2, and 3 times your initial risk.
Daily Inside Bar Buy Example
Let’s look at another stock chart and this is just the hourly time frame. The daily chart had an inside candle set up.

This example shows what happens when price does not gap up over the trend line. This allows a smaller stop loss which can, when using proper risk protocols, allow slightly larger position sizing.
We will buy stop the high or, depending on the trader, market in at the close of the breakout candlestick.
Let’s look at a sell setup.
This is a tough chart due to the huge momentum candle that broke the trend line.
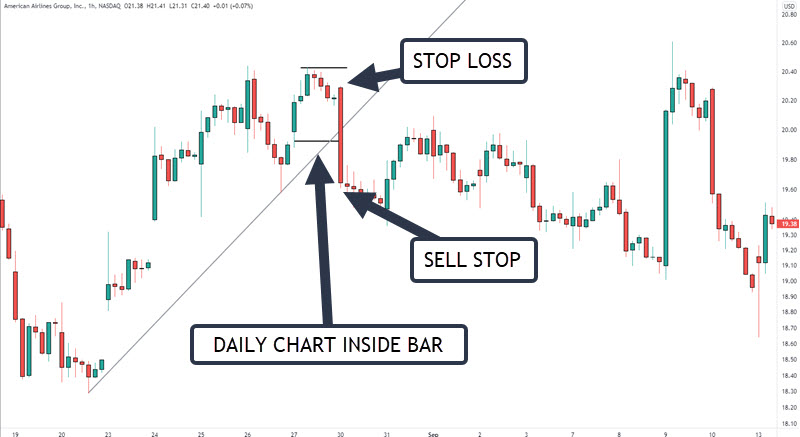
This stock was making lower highs and lower lows on the daily chart so short made sense.
The stop loss is quite large and that may be something for you to consider when building your trading plan.
- Do you skip these trades?
- Smaller risk percent because you expect a pullback after a large move?
I will give you an adjustment later for these big momentum candles so you can still play these moves if you choose.
Price did drop 3% from entry before roaring back to where your stop would be.
How would you manage this type of price action? We can’t expect price to always move cleanly.

As price makes lower highs, you can trail your stop to the highs once price begins to break down. Generally, you would not place your stop at 1 until the swing low leading into 1 is broken. Some traders, once price makes a high and begins to fall, especially if it broke from a range, will adjust stops without breaking lows (or highs).
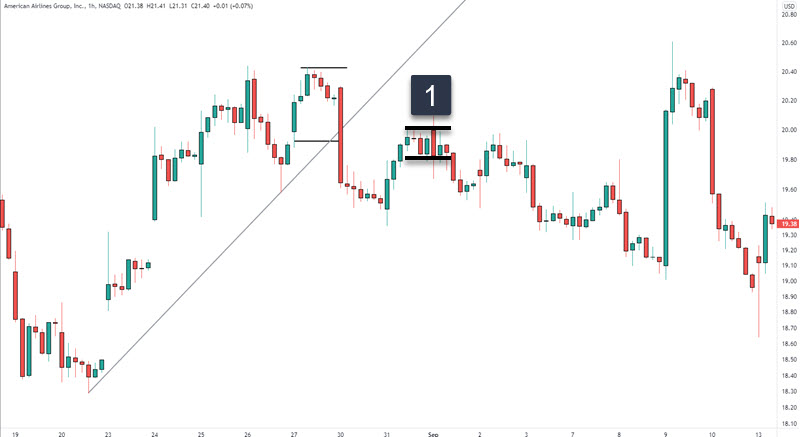
You can see at number 1 how price ranged and then broke to the downside. You could then adjust your stop to just above that range once price has made the obvious break.
What About Cryptocurrencies?
This is ETHUSD and just like that last chart, the breakout candlestick is large. Why is the stop loss at that location?

This is an hourly chart and after the break out, dropping to the 30 minute chart broke that candle into two separate ones. I simply used the low of the second candle that formed to complete the hour.
You can even drop lower but just be warned that price can and does retrace after breakouts. Too close and you could be stopped out.
Of course, if the setup is still valid you can re-enter at the same price.
Jump On AMC
Everyone knows about the recent run, and drop, of the stock AMC. Could you have been in just before the big move?
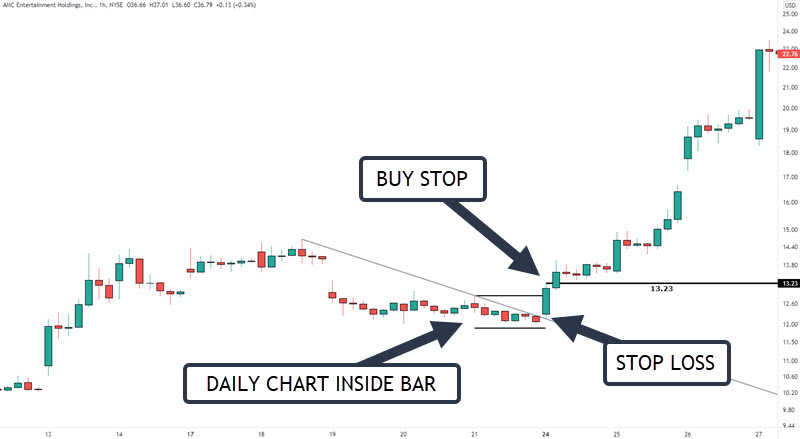
To keep it transparent, the daily chart inside bar was the last one before the run. You can see your entry would have been around $13.23 and had you positioned for the big move up.
Depending on how you take profits, you could have doubled your money in four days.
One More Thought About Profits
How do you get into the trade?
A trend line break.
Could you use that to ride the trend?
Yes.
If you would have used the trend line drawing method I outlined here, you’d have enjoyed a healthy run up in AMC.
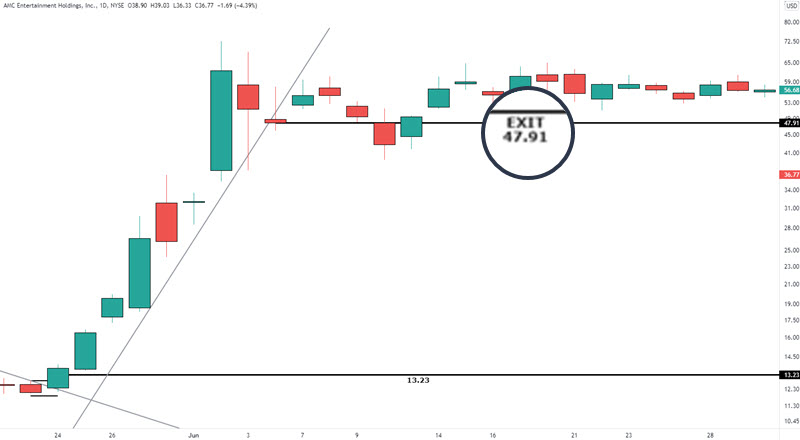
You wouldn’t be selling at the top of the move but I think anybody would enjoy a 250% price move!
Conclusion
There are a few things that you have to add to your trading plan and one would be to ensure you are not in a trading range.
Look for an inside bar that takes place as part of a corrective swing. While it may range right after a trend line break on the lower time frame, that is not something you would know.
You may also encounter multiple days of inside bars. If they are getting smaller or staying relatively the same size, you are actually inside the formation of a chart pattern called a triangle. You can learn about these in my complete guide to trading a triangle post.
There is a lot of opportunity inside of this trading strategy. Inside bars are a consolidation and a trend line measures the rhythm of the market. What you are essentially trading is a break from a range, a change in the market rhythm, and that can lead to a very profitable strategy.