- January 4, 2022
- Posted by: Shane Daly
- Category: Trading Article

Moving averages come in as many lengths as you can think of. At the very basic level, you will have short term, medium term, and longer term moving averages.
Some of the more popular moving average settings are:
- 9 EMA/SMA
- 20 EMA/SMA
- 30 EMA/SMA
- 50 EMA/SMA
- 100 EMA/SMA
A 9 period SMA will react faster to a price change than a 50 or 100 period average.
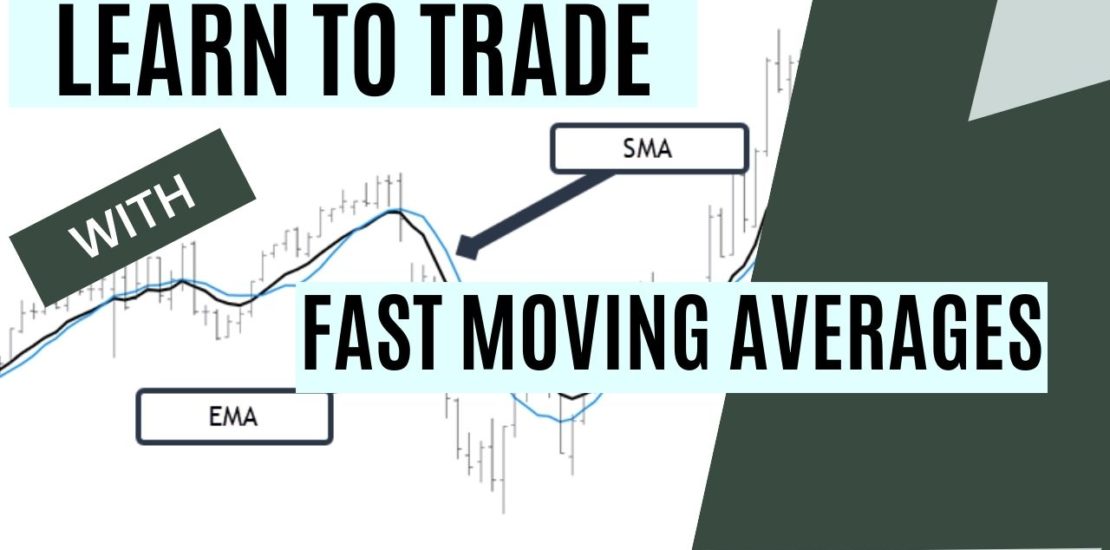
Using the exponential moving average will see price react a little quicker than the simple moving average due to the calculation involved.
Simple Moving Average
The calculation is very simple: add the last N closing prices and then dividing by N.
Using a 5 period SMA as an example: ( 5 + 5.6 + 6.2 + 6.9 + 5.3) / 5 = 5.8. The moving average would show a price of $5.80
The next period would drop the first 5 in the equation as the SMA uses the standard calculation for averages.
Exponential Moving Average
The EMA will place more importance on the recent price than it will on the previous price points. This feature will allow the same period as the SMA to react quicker to price movements even though you are using the same length.

The formula is: EMA – K x (CURRENT PRICE – PREVIOUS EMA) + PREVIOUS EMA
It doesn’t end there. You need to figure out K which has it’s own calculation: 2 ÷ (number of time periods + 1)
Using a 10 period EMA as shown in the chart above, the calculation would look like this.
K = 2/(10+1) = 0.18 OR 18%
This means that a 10 period EMA would weight the most recent price by 18% giving it a faster reaction time to price.
Should the moving average type, SMA or EMA, matter enough to turn a losing trading strategy to a winning strategy?
No.
Just pick an average type and use that.
While many will say “institutions use X moving average”, the truth is there is no quantifiable data to prove that to be the case. That insight, if you can call it that, has been passed down for generations. Question the validity of that statement and you can come up with your own answer.
Why Faster Moving Averages?
The one feature I like about a fast moving average, using the simple average formula, is not only can it show a strong move in price, it can also show consolidation.
Using a strong move in price (seeing how far price is away from the fastest moving average you are using) and then looking for consolidations for a continuation, is a very viable trading method.
In fact, it is my preferred approach.
Moving Averages and Consolidations
I know we’ve all heard that moving averages are dynamic support and resistance. While it may appear that way, it is simply the moving average catching up to price.

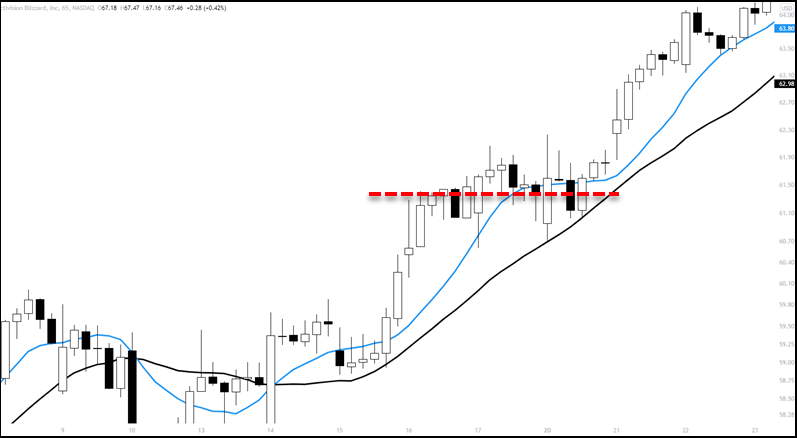
In the middle of the chart, the closing prices of each candle on average over 10 periods (simple moving average), is not really rising. Price is ranging sideways as the moving average is then able to catch up to the sideways price.
The 20 period SMA, the black line, continues to rise but remember it is just the average close over 20 periods. The red line shows the approximate middle of the range, the average.
I know some will say that the 20 SMA actually had a candle’s low bounce right off of it proving it was support.
But did it really?
The moving average only finishes plotting on close of the period. The moving average closing price is unknown until it does and a higher closing price on the candle will “pull up” the average.

The only known value while that large white candle was forming, was the previous candle and the price of the average on that date. If it were acting as support, it would have bounced from the price that was plotted the day before.
The faster the moving average, the faster it will meet up with consolidating price action.
How Long For A Consolidation?
Once price makes a strong move in one direction, it is normal for price to pause. During those pauses and the subsequence breakout, that is the time to get involved for a potential move in the same direction.
One good use of a moving average is to look for price and the average to meet.
There is validity with the rule of thumb about using moving averages only with trending markets. But, we can’t forget how great they are in showing us a market in consolidation and can also give us a “period of time” it’s consolidated for.
This is a daily chart of JXN that I started trading the tail end of 2021.

A fairly large run in price put it on the radar as price peeled away from the fast moving average. After a big move, we need to see consolidation and I like to see price and the moving average, either 10, 20, both, start to mingle with price.
Without some type of consolidation, you may end up buying the high print only to see a sharp reversal against you.
When I see the moving average close to price, I know at a glance that price has not put in large moves since the run up. This means I also know that it’s consolidated for a few days once the moving averages meet price.
These are simple chart patterns and trade entries:
- This is a bull flag and the trade is entered after a strong close outside the upper trend line (or an opening range breakout)
- Sideways consolidation and a failure test of the lows of the range. This is an early entry when price breaks the high of the reversal the next day
I am not trading the averages as support or resistance. I am trading the chart patterns and using the averages as a “measuring stick” for the consolidation.
How long for the consolidation?
I want to at least see a touch of a moving average and then a chart pattern I can trade. I also want to see the patterns begin to form high up on the impulse move. I want to see there is interest in the instrument and if we get a strong selloff after a big move, the odds decrease on a successful or long running trade on the next move
Once I see momentum to the downside when looking for a long trade, I hold off on trading the instrument to the long side. This is my standard rule for trading any pullback in price.
Failed Chart Patterns
This is an example from ATKR and is a good example of using the whipsaw motion of price around the averages. When you see price whipping around the averages, you are looking at choppy price action that is dangerous to trade.
However, inside of the whippy price moves, patterns will begin to form and in this case, it was a triangle.
Price had made a strong run up and began to consolidate high up on the impulse move.
For the triangle, we need at least four obvious points:
- The final high of the move before the consolidation is point 1
- A pullback in price
- Another move to the upside that puts in a lower high
- A move to the downside that puts in a higher low

The dashed line shows where the triangle pattern failed.
Keep in mind the context is still bullish due to the big move up and the consolidation near the high of the move.
We get a failure test of support and price is bought up. Price made a 20% jump from that zone and quickly failed. This pattern then became more of a sideways trading range better seen on the weekly chart.
The key is not to give up if the pattern you are looking at has failed.
The triangle turned into a support holding setup with a failure test of lows leading to a $15 jump in the price of this stock. If price had broken down further, I would have needed to see another strong move in price before finding interest again.
Watch The Next Move
This is PLUG and is an example of the importance of each watching each impulse swing to see how big it is.

The first move up was a 42% jump in price. Price consolidated near the highs of the move and began to meet up with the 10 SMA.
You can see resistance holding as price is essentially making higher lows into resistance. If you read Secrets of Trading Breakouts, you will note that price basing under resistance, is generally bullish.
Here is the issue with this chart: The next move up was almost half of the first one. Swing analysis would tell you that buying was drying up at these higher prices.

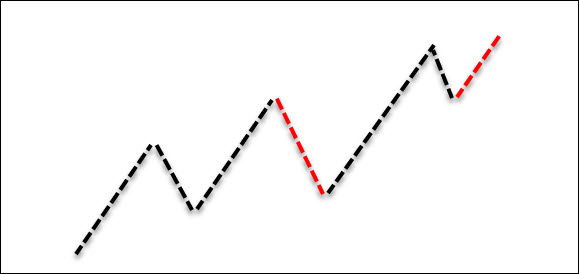
The red lines indicate moves you’d want to be aware of.
- The corrective move is deeper than the first one meaning more traders either took profits, or sellers entered the market
- After a big move up and shallow pullback, the impulse move was shorter than the previous. This is either lack of buying interest, profit taking, or sellers starting to enter
Looking back at the trading chart, I began to see the formation of a triangle that quickly fell apart with a new candle low into support.
There was no test of lower prices below support, the failure test, and no trade entry.
Given the lack of strong movement to the upside leading into the consolidation, you want to see a quality setup taking place. In this case, we didn’t.
Notice that all these setups were only considered after enough price action and time was taken to have the moving averages catch up to price.
When trading consolidations, time can be an important factor.
Summary
Moving averages have their use and the fast moving averages can be important tools for any trader.
Seeing price pull away from a short term moving average such as the 10 SMA, shows strength in the current move. We are seeing, on average, higher closing prices and the bigger that daily range, the more price pulls from the average.
Letting price settle into a consolidation where the moving average gets close to price gives us the benefit of time in the pattern.
It is important to have a few entry techniques and that can include: trend line breaks, failure tests, opening range breakouts, or strong closes beyond the level.
We didn’t cover exits and protective stops however you can keep them simple. An ATR for your stop, low of the day you enter can be used as well.
Profit targets can be previous swing highs/lows or multiples of your risk.
Whatever pattern or moving average you choose, ensure all of what you do is written in a trading plan.
