- April 21, 2015
- Posted by: CoachShane
- Category: Trading Article

My ritual for intra-day and swing trading is pretty much the same. I scan charts, look for certain trading setups and conditions, then the appropriate action is taken.
While swing trading involves longer term charts, the plays on the smaller time frames for day trading are influenced, in part, by what is happening on the higher charts.
When conditions take place on the smaller charts in line with conditions on the higher chart, good things can happen.
Nested Trading Setups
These “nested” trading setups apply to any trading intention from scalping and day trading to swing and position trading. Searching out these types of plays while not foolproof, can often times end up with solid moves in the direction indicated by the patterns.
Keep in mind though that just because a scan shows the potential for setups,there are many times that no trade actually takes place.
The formula is quite simple:
Potential setup + setup + trigger = trade
Being prepared though can never be overstated.
This chart shows the daily chart of the Dow E-Mini. It clearly shows a channel in this market but look at the last red candle. The high of that candle was put in around 3:00 a.m. New York time. That information will be key later on.
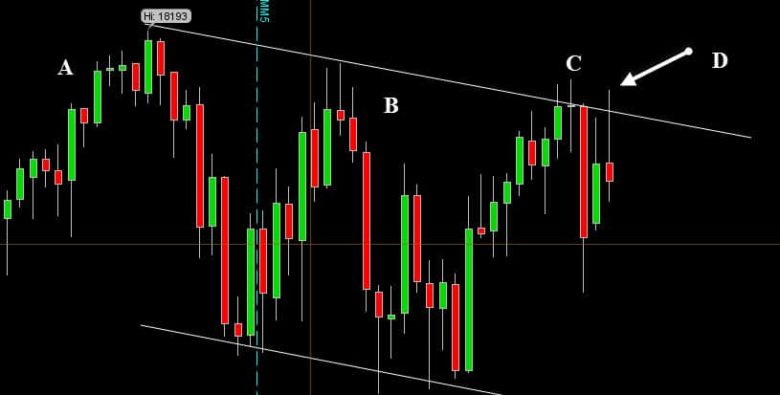
Breaking down the YM chart on the daily time frame:
A. Price completed a run up
B. Downward bias in the channel (but a bull flag weekly?)
C. Price currently at the top of the channel
D. High of candle in the early hours
I don’t trade the mini Dow very often but when a condition looks promising, I will keep it on the radar.
What makes this condition attractive is the location of the current trading action. It could break to the upside but given earlier trading action, I was leaning to the short side and just needed price to show the way.
Setup And Trading Trigger
This one minute chart of the YM is where all the scalping action takes place. It’s not always just a scalp as there are times where conditions setup that allows for extended targets. They are not always reached due to tight management of the trade but when they are, they can add 20-30 points to your total.
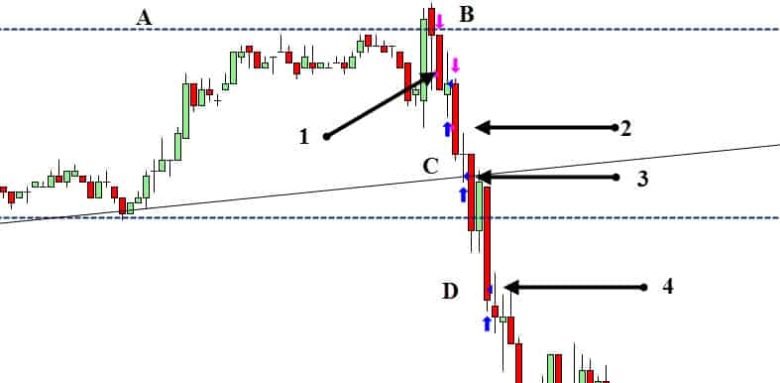
Looking closely at the one minute chart (keep in mind the high was made and price had dropped):
A. An area that provided resistance
B. Level broken, bulls can’t take the reigns although they tried
Given the scan on the daily and what’s unfolding on this chart, a scalp was initiated at #1 when price challenged the low of the preceding candle. Price dropped and after about 7 points, it started to retrace and eventually hit the stop for a +2.
Price then breached the low of the final gasp green candle (trade trigger) and another short was entered at #2.
The scalp portion was taken at #3 for +9.
C. Price slams through trend line with force
D. Price reaches a level that turned price earlier
The extended target was hit for +30 on the final equal portion of the trade at #4.
There are many markets available every day that you can focus on. If you can also day trade stocks, it’s almost limitless in opportunity. I think a good use of your time, especially for day trading or scalping, is to look at higher time frames and see if price is showing a pattern.
It could be something simple:
- Is price sitting at a support/resistance area after a momentum move?
- Are you at the top or bottom of a range?
- Is there a flag pattern with price pushing close to the boundary?
There are quite a number of conditions you can look for that can help set up your watch list for the day. Obviously you may be limited by your account size or current exposure but that is not necessarily a bad thing. Sometimes having limited options can be a benefit as you are not tempted to expose yourself to too large of an account risk.
An exercise you can do is to go over some previous trades and go to higher time frames (3-5x trading time frame) and see if your setups were taking place in a context that was favorable in the higher time frame.
For example: You traded a retracement on a trading time frame that was an easy play. On closer examination, price was pulling back to a zone of support on a higher time frame. This may lead you to a trading rule that requires pullbacks or a rally to be heading to an area on a higher time frame that is conducive to the move you are seeking.
Seeing if the odds are stacked in your favor for trading setups does not guarantee 100% winning trades. It can however increase the probability that the setup you are looking to trade on the lower time frame, will play out in accordance to how you see the trade playing out.