- January 10, 2025
- Posted by: Shane Daly
- Categories: Advanced Trading Strategies, Trading Article

The bear flag pattern is one of technical analysis’s most reliable continuation signals, yet many traders struggle to execute it profitably. This bearish formation, characterized by its distinctive flagpole decline followed by a consolidation phase, offers opportunities for both novice and experienced traders.

While the basic structure appears straightforward, mastering its details requires a deep understanding of volume dynamics, precise entry timing, and disciplined risk management. The difference between consistent profits and repeated losses often lies in the subtle details that many traders overlook.
TLDR
- Identify the bear flag pattern by locating a steep downtrend (flagpole) followed by a consolidation period between parallel trendlines.
- Confirm pattern validity by checking for decreasing volume during consolidation and a significant volume surge during breakout.
- Enter trades when price breaks below the flag’s lower boundary with a stop-loss placed above the flag’s upper boundary.
- Target profits using the flagpole height projected from the breakout point, maintaining at least a 2:1 risk-to-reward ratio.
- Monitor multiple timeframes and volume patterns to avoid false signals and premature entries during pattern formation.
Understanding Bear Flag Pattern Mechanics
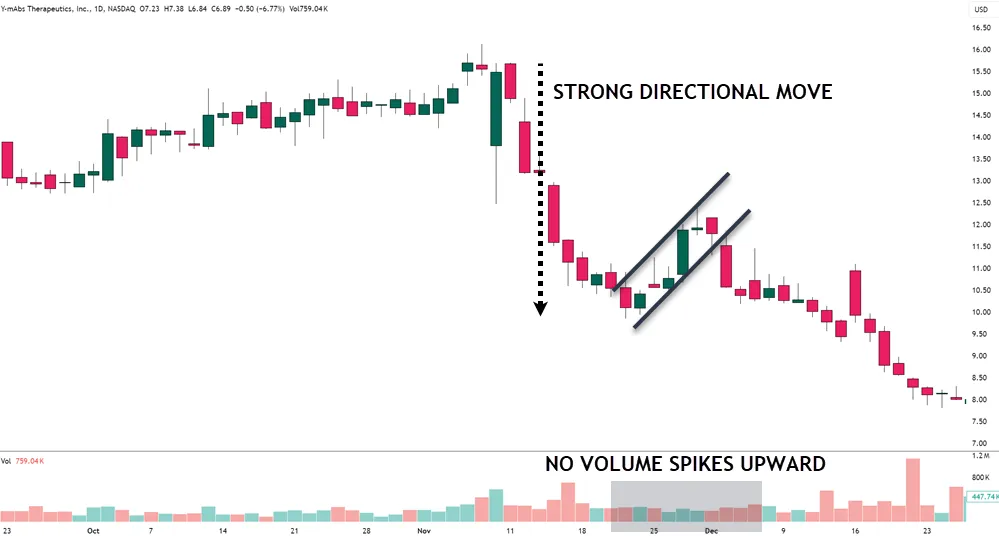
Technical traders rely on the bear flag pattern as a powerful signal to identify potential continuation points in a downtrend. When I analyze this pattern, I look for a sharp initial decline forming the flagpole, followed by a consolidation phase where price action moves sideways or slightly upward in a channel formation.
What makes this pattern particularly interesting is how it represents a temporary pause in the broader bearish trend, giving us time to prepare for a potential entry point. During the consolidation phase, we typically observe decreased trading volume, which is exactly what we want to see before confirmation.

The real excitement comes when price breaks below the lower boundary of the flag formation, signaling that bears are regaining control of the market. Setting profit targets based on the flagpole’s height provides a systematic approach to exit planning.

- Decline in price in an overall downtrend
- Pullback in price that forms a general flag formation
- This measures the length of the flagpole
- This takes the flagpole length and project the same length from the peak of the flag.
I’ve found that the most reliable setups occur when the bear flag pattern emerges within an established downtrend, as this alignment with the primary trend increases our probability of success. Implementing trailing stop losses during the trade helps protect profits as the pattern unfolds.
When developing your trading strategy around this pattern, remember that volume characteristics play a crucial role in validating the setup.
Strong momentum preceding the pattern formation significantly increases the likelihood of a successful continuation trade.
Key Pattern Formation Elements
When analyzing bear flag patterns, I always begin by confirming a strong downward trend through the flagpole, which should exhibit decisive selling pressure and substantial volume.

You’ll want to observe how trading volume typically decreases during the flag formation phase, while the price consolidates in an upward-sloping channel that shouldn’t exceed a 50% retracement of the flagpole.
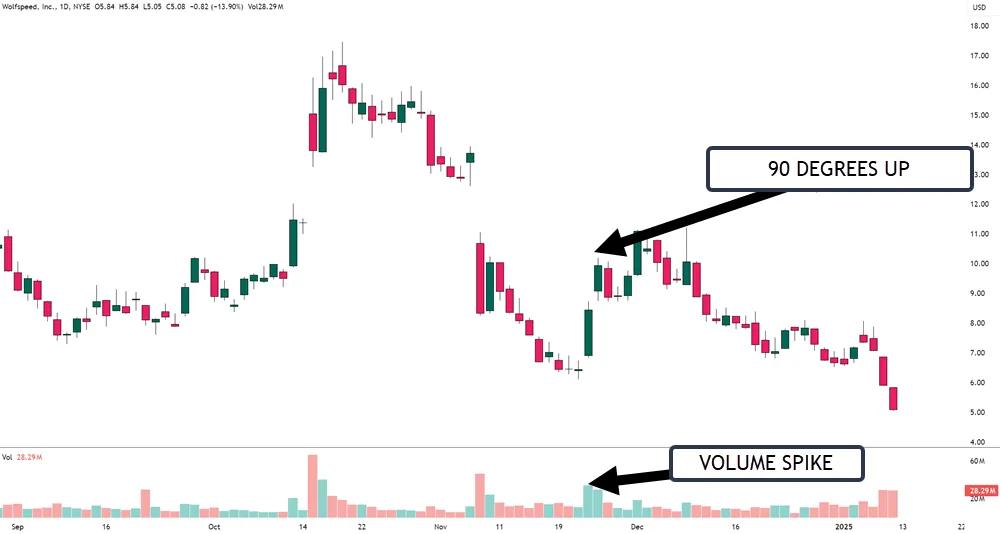
The angle of the flag’s slope must remain relatively modest, as an overly steep angle often signals that the pattern may not follow through with its expected downward continuation.
Setting appropriate stop-loss orders based on market behavior is essential to protect your capital during bear flag trading.
Understanding implied volatility helps traders gauge potential price fluctuations and set more precise entry points during bear flag formations.
Having an effective exit strategy before entering the trade helps prevent emotional decision-making during market turbulence.
Identifying Strong Downward Trends
Market direction plays a huge role in identifying a bear flag pattern, with a strong downward trend serving as its foundation.
| Component | Characteristics | Key Points |
|---|---|---|
| Overall Pattern | Consecutive lower highs and lower lows | – Demonstrates clear bearish sentiment |
| Flagpole | Sharp decline | – Typically exceeds 10-15% – Occurs before consolidation phase |
| Volume | Higher-than-average during decline | – Confirms bearish momentum – Often coincides with market events |
| Consolidation (Flag) | Limited retracement | – Shouldn’t exceed 50% of flagpole length – Forms the flag portion of the pattern |
| Trend Strength | Pronounced drops | – Indicates shift to negative market sentiment – More reliable for continuation moves |
| Trading Strategy | Early recognition of strong downtrends | – Needed for positioning in short trades – Helps capitalize on potential continuation moves |
Volume During Pattern Formation
Volume patterns play a role in validating the bear flag formation, with distinct characteristics appearing during each phase of the pattern’s development. When analyzing a potential bear flag pattern, I consistently look for high volume during the initial flagpole formation, which demonstrates strong selling pressure driving the downtrend.
The consolidation phase typically shows decreasing volume, indicating temporary price equilibrium between buyers and sellers.
| Phase | Volume Characteristics |
|---|---|
| Flagpole Formation | Heavy volume, strong selling pressure |
| Early Consolidation | Gradually decreasing volume |
| Mid-Consolidation | Low volume, sideways movement |
| Late Consolidation | Very low volume, potential buildup |
| Breakout | Significant volume surge |
When designing trading strategies around the bear flag pattern, pay particular attention to the volume surge during the breakout phase. This increased volume confirms the pattern’s validity and suggests that sellers are regaining control.
I’ve found that successful trades often occur when volume follows this classic sequence – high during the flagpole, declining during consolidation, and exploding during the breakout (or soon after), making it a reliable indicator for pattern confirmation.
Flag Slope Requirements
Understanding the slope requirements of a bear flag pattern is important for accurate pattern identification and trading success. When analyzing the flag slope in this continuation pattern, I’ve found that the most reliable formations exhibit an upward tilt between 0 to 30 degrees, representing a temporary pause in the broader downtrend.

During the consolidation phase, price movement should be contained within two parallel trendlines, creating what’s essentially a rectangle tilting slightly upward.
One critical aspect I always emphasize to traders is that the flag portion shouldn’t retrace more than 50% of the original flagpole, as this could signal a potential trend reversal rather than continuation. The slope’s gentle upward angle represents the natural ebb and flow of selling pressure, where we typically observe a volume decrease during the pattern formation.
The key is to recognize that while the slope requirements aren’t set in stone, they must reflect a controlled pullback against the primary downtrend. When these slope characteristics align with proper volume patterns and price action, we can more confidently anticipate the next leg of the bearish move.
Identifying Strong Trading Setups
Successful identification of strong bear flag patterns requires traders to recognize several critical components working in harmony. When I look at potential bear flag setups, I look for a sharp downward flagpole showing at least 10-20% price decline, followed by a controlled consolidation phase lasting 3-10 days. T
he most reliable setups demonstrate decreasing volume during consolidation, suggesting waning buying pressure. Similar to descending triangle patterns, traders should closely monitor volume characteristics to validate potential breakout signals and avoid false moves.
| Component | Key Requirement | Trading Significance |
|---|---|---|
| Flagpole | 10-20% decline | Shows strong selling |
| Consolidation | 3-10 days | Confirms pattern formation |
| Volume | Decreasing | Indicates weak buyers |
| Breakout | 30%+ volume spike | Validates downward trend |
| Stop-Loss | Above flag top | Manages trading risk |
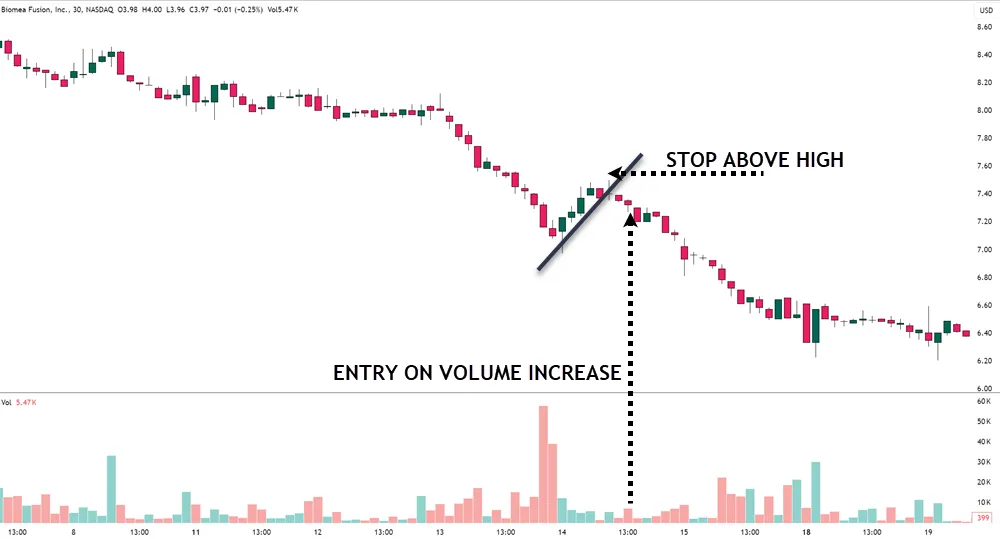
To confirm the bear flag pattern and establish ideal entry points, watch for a decisive break below the flag’s lower trendline with increased volume. I recommend placing stop-loss orders just above the flag’s upper boundary to protect against false breakouts.
Remember, the strongest trading setups typically show clear flagpole formation and maintain the consolidation phase without retracing beyond 50% of the flagpole’s height.
Volume Analysis and Confirmation
How can traders validate a bear flag pattern with confidence? The key lies in understanding volume dynamics, which serve as a confirmation tool for this powerful bearish formation.
Relative strength index analysis provides additional confirmation by identifying overbought conditions during the flag’s formation.
In my years of trading, I’ve found that volume analysis provides the most reliable validation of bear flag patterns, particularly when examining the relationship between price movements and trading activity.
To properly confirm a bear flag pattern, we need to observe two distinct volume characteristics. First, look for heavy selling pressure during the initial flagpole formation, where volume should be notably above average.
Then, during the consolidation phase, we want to see volume decrease significantly, indicating waning buying interest. What really seals the deal, though, is the breakout confirmation – when price breaks below the flag’s lower trendline, volume should spike to at least 50% above daily averages.
I always remind traders that this volume surge is crucial because it helps distinguish genuine breakouts from false signals.
Using trailing stop orders can help protect profits while allowing the bearish momentum to fully develop after the pattern confirms.
Risk Management Strategies
Smart traders know that effective risk management is the foundation of profitable bear flag trading. I emphasize that setting precise stop-loss orders just above the flag’s upper boundary is good for protecting against potential losses if the pattern fails to perform as expected.
To maintain consistency in our trading approach, focus on establishing favorable risk-to-reward ratios, typically aiming for 2:1 or 3:1 at minimum. This means carefully calculating position sizing based on the distance between our entry point and stop-loss level, ensuring we never risk more than we’re comfortable losing on any single trade.
Truthfully, I am very happy with a 1:1 risk reward ratio as the percentage of time that occurs far outweighs a :1:2(3) ratio.
I’ve found that using trailing stop-loss strategies allows us to lock in profits while protecting our downside as bear flag patterns develop. This is very important when the overall market and not just the instrument is in a downtrend.
One often-overlooked aspect of risk management is portfolio diversification. By spreading our trades across multiple bear flag patterns and different asset classes, we create a natural hedge against market uncertainty.
Entry and Exit Points
Trading the bear flag pattern effectively requires precise identification of entry and exit points to maximize profit potential while minimizing risk exposure.
When I analyze this pattern, I look for a clear break below the flag’s lower boundary, which signals that the downtrend is likely to continue. This breakout point, accompanied by increased trading volume, provides traders with an ideal entry opportunity.

To protect our trading capital, I always recommend placing stop-loss orders just above the flag’s upper boundary. This strategic placement helps safeguard against potential false breakouts while maintaining a favorable risk-to-reward ratio of at least 2:1 or 3:1.
Traders can enter positions with confidence when these key elements align, knowing their maximum potential loss is defined.
For profit targets, we measure the flagpole’s length and project it downward from where prices break below the flag formation.
This measured-move approach provides a systematic method for establishing exit points, though I suggest monitoring market conditions and potentially taking partial profits as the price approaches these targets.
Common Bear Flag Trading Mistakes
When I guide traders through bear flag analysis, I consistently observe three critical mistakes that can derail even experienced market participants: rushing into false breakouts, misplacing stop-loss orders, and disregarding volume confirmations.
Trading a bear flag pattern without proper confirmation often leads to premature entries, where enthusiastic traders jump in before the pattern completes its formation and validates the downward trend.
While many focus ONLY on price action, the importance of volume analysis cannot be overstated, as declining volume during the flag’s formation and increasing volume during the breakdown are essential components of a reliable bear flag signal.
False Breakout Entry Errors
False breakouts represents one of the most challenging aspects of bear flag pattern trading. When price action briefly pierces the lower boundary only to reverse quickly, traders often find themselves caught in losing positions, leading to unnecessary losses instead of capturing the anticipated downtrend continuation.
I’ve observed that market volatility, particularly during economic releases or unexpected news events, significantly increases false breakout probability. That’s why I always emphasize the importance of volume analysis in confirming breakout validity – without increased selling volume, we’re likely witnessing a fake move.
Also, traders who set overly tight stop-loss orders without considering broader market context often find themselves stopped out during volatile periods, highlighting the need for adaptive risk management strategies. Consider using the ATR to help adjust your stop loss outside a normal range of price movement
One approach I’ve found particularly effective is using multiple timeframe analysis. When we spot a potential breakout on lower timeframes, it’s essential to verify alignment with higher timeframe trends.
Without this confirmation, we’re essentially trading blind and increasing our exposure to false breakout risks, which can quickly erode our trading capital.
Improper Stop-Loss Placement
Stop-loss placement stands as a critical cornerstone in successful bear flag trading, yet many traders stumble by positioning their stops inappropriately.
When I analyze failed trades, I often notice traders setting their stop-loss orders too close to the breakout point, making them vulnerable to normal price fluctuations in volatile markets.
One of the most common mistakes I see in bear flag pattern trading is the rigid placement of stops just above the flag’s upper boundary. This approach fails to account for the natural ebb and flow of price action, leading to premature exits before the anticipated downtrend materializes.
Many traders also make the error of using fixed percentages or arbitrary distances for their stops, rather than considering the specific volatility characteristics of the asset they’re trading.
To improve your risk management with bear flags, you must analyze the pattern’s width and historical price behavior. By understanding how much room the price needs to breathe, you can position your stops at levels that protect your capital while allowing the trade sufficient space to develop naturally.
Ignoring Volume Signals
Volume analysis frequently comes out as an overlooked component in bear flag pattern trading success. When traders fail to recognize volume dynamics, they miss essential perspectives that could validate or invalidate their trading decisions, particularly during the pattern’s key phases.
I’ve observed that many traders struggle most with interpreting volume signals during the consolidation period, where decreasing volume should typically accompany price action. This reduction in trading activity often signals waning buyer interest, setting the stage for a potential downward move.
During the breakout phase, we need to see increasing volume confirming strong selling pressure, yet many traders jump into positions without this critical confirmation.
What’s particularly interesting is how volume interacts with volatility during the pattern formation. When we see higher volatility coupled with decreasing volume in the consolidation phase, it strengthens the likelihood of a successful breakout.
To improve trade reliability and avoid false breakouts, you must integrate volume analysis with price action at critical levels, as this combination provides a more complete picture of market dynamics.

Your Questions Answered
What Is the Success Rate of the Bear Flag Pattern?
Historical performance trends indicate bear flag effectiveness ranges between 60-70%, with success rate analysis showing higher probabilities when supported by volume confirmation, proper market conditions influence, and multi-timeframe considerations.
What Is the Bearish Flag Strategy?
The bearish flag strategy identifies downtrends through technical analysis, confirming entry points when price breaks below consolidation channels. Success depends on volume considerations, proper risk management, and strategic exit timing across relevant timeframes.
What Is the Bear Flag Consolidation Pattern?
The bear flag consolidation pattern is a technical analysis chart pattern showing a downward price movement followed by a brief upward retracement, requiring volume analysis and breakout signals for effective risk management.
How Accurate Is Bear Flag?
Bear flag patterns show 60-70% accuracy when supported by volume analysis techniques and proper market sentiment analysis. Success rates improve with strong pattern recognition skills and comprehensive risk management strategies.
