- January 16, 2019
- Posted by: Shane Daly
- Category: Trading Article
The descending triangle chart pattern is another bearish chart pattern that has validity in your trading.
Why?
The descending triangle is one of the continuation patterns which highlights market action that is tipping its hand to more downside.
Like the ascending triangle I wrote about, understanding this pattern can get you into breakout trades that have the potential to run in price.
Let’s cover some basics before we look at strategies and that includes…..
How To Find Descending Triangles and How Do They Work
We are looking at the exact opposite of its cousin, the ascending triangle.
The descending triangle is a series of lower highs while new lows are not being made. (Notice the trend line connects a series of lower highs)
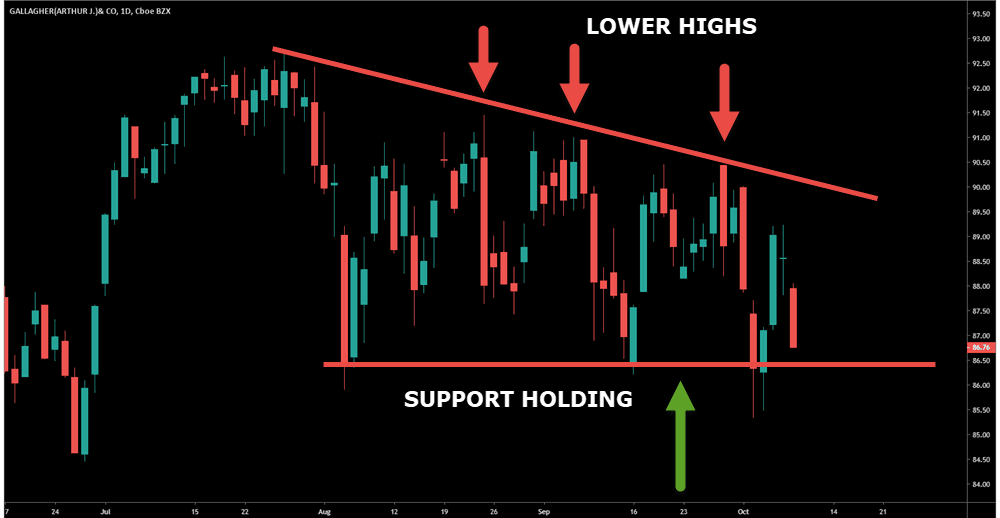
That means that the buyers are putting up a fight as they keep the market from dropping and sellers can’t yet push the price below the support level.
The fact that sellers keep the selling pressure on even though lows aren’t being made (but neither are new highs), shows that the descending triangle is a bearish pattern.
Why do traders expect a strong breakout?
Stop loss locations from the buyers that are supporting price.
I always say textbook trading is not always a smart play because other traders know your game.
Buyers at support usually keep their stop losses just below support.
Support breaks, stops get hit, and price goes tumbling to the downside.
Like all chart patterns, including the other triangle patterns I covered, if you have to search and squint for the pattern, it isn’t there.
The best patterns are the obvious ones.
Trading The Descending Triangle – Let’s Look At Strategies
Since we are looking for a break of the support line, many traders will trade the breakout of the descending triangle.
Let’s look at that strategy.
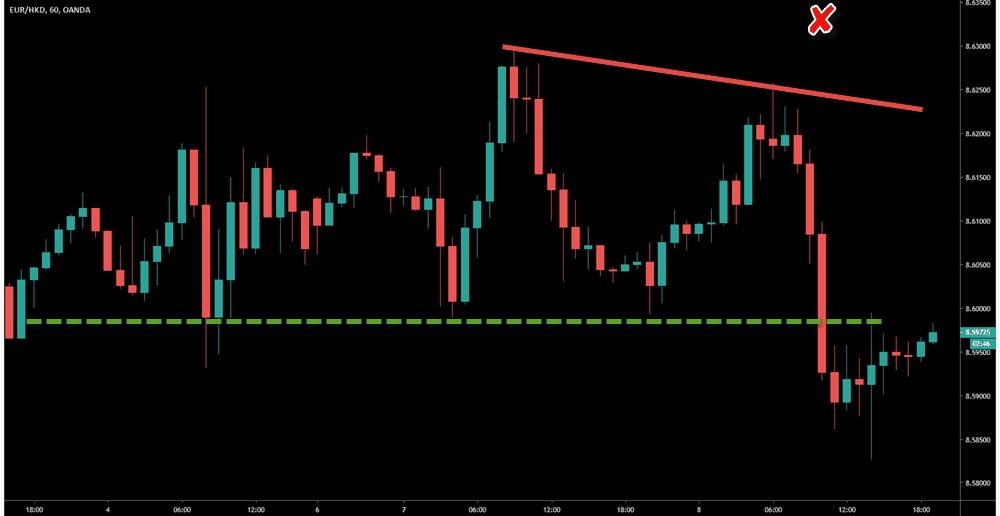 Not a picture perfect descending triangle (very seldom are they), but the concepts are the exact same and we can draw a descending trend line to connect lower highs.
The breakout strategy is to place a sell stop just below the support level. If/when the support breaks, the stops get hit and price drives effortlessly in your direction.
In theory.
The truth is, depending on where the breakout candlestick originates from, a snap back in price is a very real event. Our stop loss would be above triangle (I use ATR stops) and though it is not challenged, this snap back in price can spook a trader.
Many traders, if they don’t get positive feedback on the trade, will market out of the position.
My Risk Increased!
Another very real event, one that concerns me, is the reality of slippage.
You may not see slippage in the Forex market (but will have to deal with increasing spreads during higher volatility times) but in futures and other markets, it’s a threat.
If I am risking 1% of my account and have a 100 pip stop from entry (using a FX example), when price breaks with slippage I may get filled 20 pips lower. This will increase my risk percentage which, depending on your overall portfolio risk, can be an issue.
The good thing about playing the actual breakout is you will participate in 100% of the extended runs that can occur.
Watch The Break, Play The Pullback
You’ve heard it a thousand times, “breakout pullback.”
What does that mean?
- Price breaks support and heads to the downside
- Price runs back towards the breakout zone around the support level
- Trade the continuation back in the direction of the break
This is a time tested trading strategy for all types of breakout trading.

If you played the initial break short, you sat through a small range and then the pullback occurred.
How would you enter a breakout pullback setup?
As price is pulling back as seen with the green circle, you can draw a trend line to show the bear flag. When the trend line breaks, you can enter the trade.
Traders will also use price action such as failure tests and momentum candlesticks for an entry trigger.
Do you see a downside to trading the breakout/pullback?
- You may have a market that breaks out and keeps running
- You need to determine what a pullback looks like; how far it pulls back, how long it takes
- You must have a trigger into the trade; candlestick patterns, small range breaks…….
The issue of a stop loss should always be a consideration.
Price pulling back above the support line of a descending triangle does not mean the breakout failed. Make sure your stop is away from the noise.
I have always advocated for the use of the average true range to place your stop loss.
Enter Before The Breakout – It Can Be Done
There is a lot of volatility around breakouts at times as well as times the breakout will just fail.
What makes sense is to find a logical area to put your trade on before the breakout. Why?
- Traders won’t have slippage but can take advantage of slippage while in the trade – quick gains
- There can be room to manage a trade
- A trade that would be a loser could give you a small profit
Sound to good to be true?
Let’s talk about basing.
What Is Basing And Why You Should Love It
Basing is when price forms a small range just above the support zone (for support level breaks, descending triangles, range breakouts downside).
Basing is an accumulation of positions while price is a few points/pips away from an actual breakout.
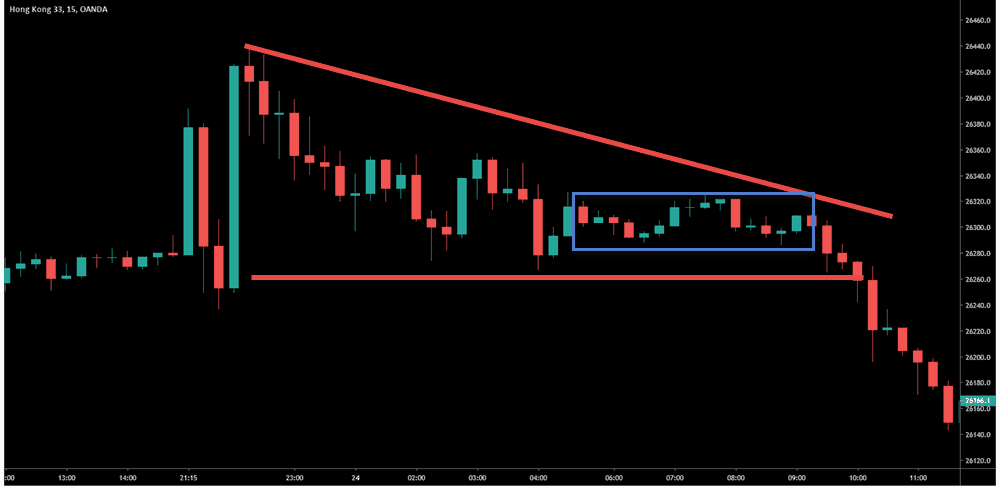
What a trader will essentially look for is a range of price action that takes place closer to the support zone of the descending triangle. I prefer it to not exceed the half way point of the entire pattern and the closer to support, the better.
Look for price action inside the range to find an entry. Can you see where you would enter inside of the blue box?
Trading one chart pattern to enter another pattern.
All we are doing is using a horizontal range chart pattern to enter the descending triangle chart pattern before the triangle breaks.
If a trader is already short and the breakout fails, there is room to cut risk drastically in the trade or exit with a small profit.
Remember the clustered stops below support?
Those, along with the “textbook” breakout traders, will help propel your trade into profit.
Speaking Of Profit Taking….
Unless you are a trend follower (who generally do not use profit orders), you want a place to exit your trade.
There are several ways:
- Multiple of risk
- Targeting former support levels below your trade
- Trailing stops
- Pattern profits
Let’s look at pattern profits.
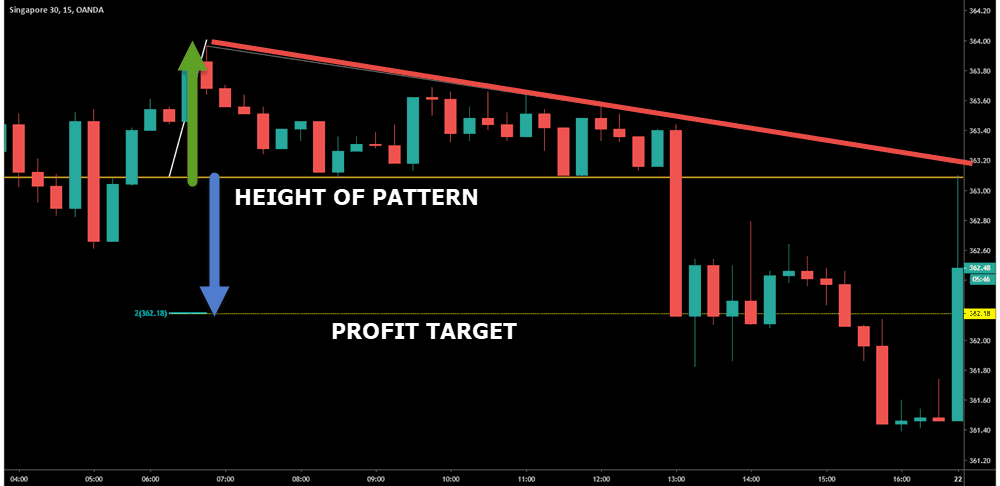
Traders will take the height of the pattern using the support zone to the highest high of the pattern (usually the last swing high before the lows).
Project the height downwards from the bottom of the support zone.
You can see in this chart that price stalled at the price target took another leg down, and off to the right, retraced all the way to the support line.
Can You Disqualify A Trade?
If you traded the breakout by waiting for the close (another viable strategy that “confirms” a break”, you’d be entering right where the price projection is.
Keep in mind that price, after a strong momentum move or extended run, generally will “snap back” against you.
This is why I look for basing – because I can profit when others either skip a trade or take a loss.
We Covered A lot….
You can certainly design a trading strategy for yourself surrounding the descending triangle when looking to short a market.
You should know:
-
- How you will determine if you have a pattern or not
- What method will you use to enter the trade?
- How will you handle stop losses?
- What is your profit taking plan?
- More importantly, how much will you risk per trade?
Let me know if you are confident in finding this pattern and how you will approach trading it.