
- May 21, 2024
- Posted by: Shane Daly
- Categories: Trading Article, Trading Indicators

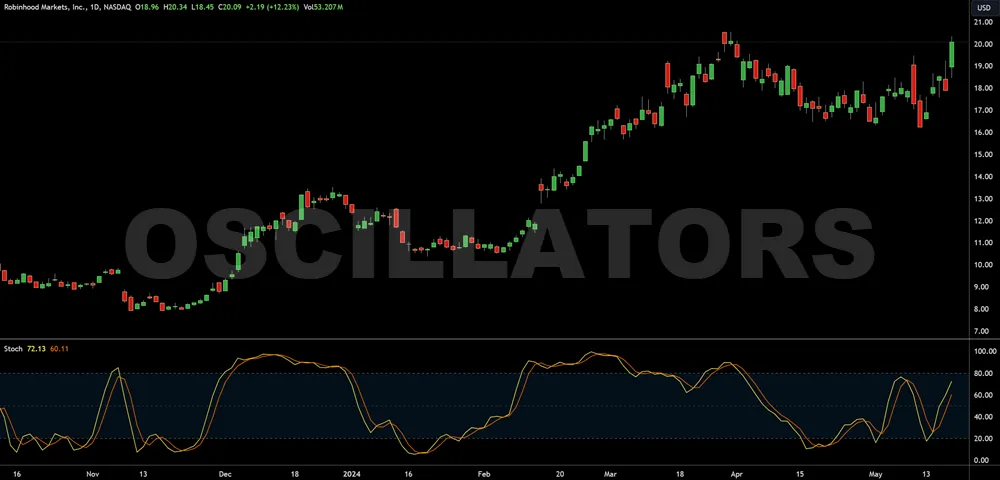
Oscillators are key momentum indicators in your trading toolkit that help identify potential market reversals and indicate overbought or oversold conditions. Tools like the Relative Strength Index (RSI), Stochastic Oscillator, and Commodity Channel Index (CCI) measure the velocity and magnitude of price movements. By analyzing these indicators, you gain clues into market sentiment and directional strength.
Main Points
- Oscillators measure momentum and reveal overbought or oversold conditions, important for timing market entries and exits.
- Customize oscillator parameters to match individual trading styles and enhance sensitivity to market conditions.
- Combine oscillators with other indicators like moving averages and MACD to confirm trends and improve accuracy.
- Use multiple timeframe analyses with oscillators to confirm signals and manage risks more effectively.
- Regular sensitivity and smoothing adjustments help adapt to changing market volatility, reducing false signals.
Definition and Purpose Of Oscillators
Oscillators play a role as technical analysis tools that help traders identify potential reversals in market trends by measuring the velocity of price movements. They’re categorized as momentum indicators, giving you details into the strength of price actions.
By adjusting oscillator parameters and settings, you can enhance their sensitivity and make necessary smoothing adjustments to reduce noise and avoid false signals where the price does not continue in line with the signal. Combining oscillators with other indicators can increase the accuracy of confirming signals, ensuring you’re making good trading decisions.
This dual-tool strategy reinforces the validity of trend predictions and potential market movements, maximizing your trading efficacy. Understanding these tools’ operation allows for refined strategies tailored to dynamic market conditions.
Role in Technical Analysis
You’ll find that oscillators, as key momentum indicators, fundamentally shape the landscape of technical analysis by quantifying the speed and change of price movements. These tools offer you a numerical basis to assess whether an asset is overbought or oversold.
Here’s how specific oscillators play a pivotal role:
- Relative Strength Index (RSI): Measures the magnitude of recent price changes to evaluate overbought or oversold conditions.
- Stochastic Oscillator: Compares a closing price to its price range over a given time frame.
- Average Directional Index (ADX): Quantifies trend strength regardless of the trend’s direction.
- Awesome Oscillator (AO): Analyzes market momentum to confirm trends or anticipate reversals.
- Commodity Channel Index (CCI): Identifies cyclical trends in commodities and other markets.
Types of Oscillators
In assessing the reliability of oscillators in trading, you’ll find four primary types that offer valuable insights: the Relative Strength Index (RSI), Moving Average Convergence Divergence (MACD), Stochastic Oscillator, and Commodity Channel Index (CCI).
Each oscillator has distinct calculation methods and applications, influencing how they signal potential market moves. For instance, while RSI focuses on price momentum and overbought or oversold conditions, MACD provides data on the relationship between two moving averages.
Relative Strength Index (RSI)
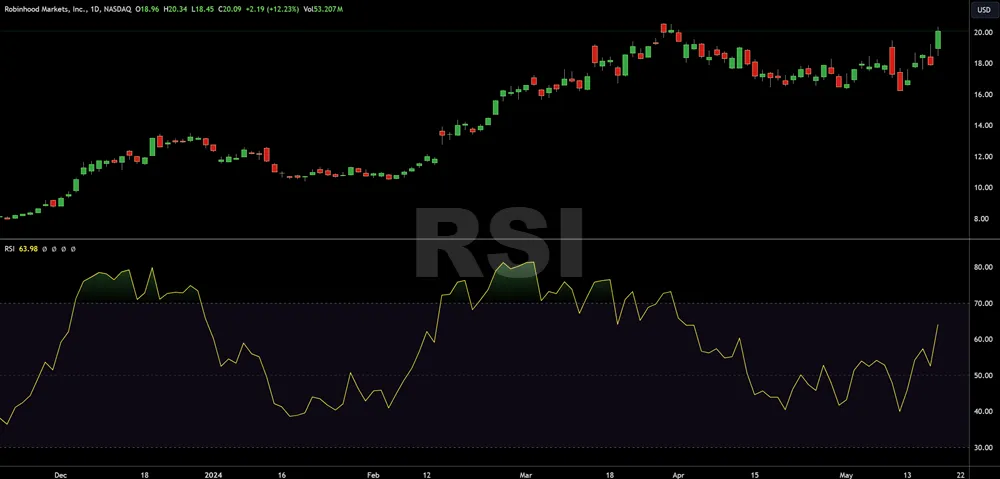
Among various trading tools, the Relative Strength Index (RSI) stands out as a powerful oscillator that measures the speed and change of price movements to help you identify overbought or oversold conditions in the market. It’s crucial for detecting shifts in market momentum and anticipating potential trend reversals.
Here’s how you can effectively use RSI in your trading strategy:
- Trend Reversals: Spot potential reversals when RSI diverges from price action.
- Divergences and Convergences: Observe divergences between RSI and price as a signal of weakening momentum.
- Signal Lines and Crossovers: Watch for RSI crossing over its signal line to gauge momentum shifts.
- Buying and Selling Pressure: RSI can indicate when buying or selling pressure is tapering off, suggesting a potential price direction change.
- Overbought and Oversold Conditions: Use RSI to identify extreme conditions where a price reversal is more likely.
Moving Average Convergence Divergence (MACD)
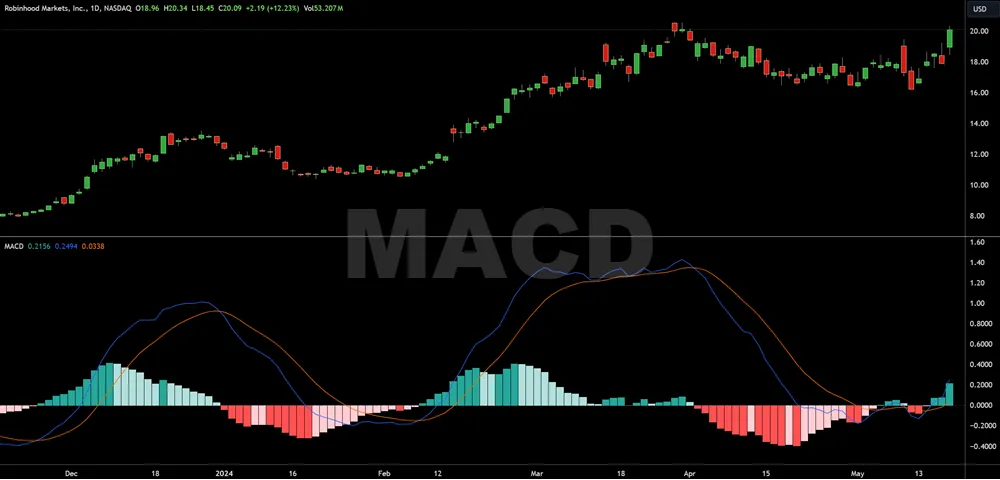
While the RSI helps identify market momentum shifts, the Moving Average Convergence Divergence (MACD) offers insights into trend duration and direction. As a cornerstone of technical analysis, MACD is a tool you can leverage to pinpoint entry and exit points, enhancing your trading strategies.
This indicator utilizes two moving averages (fast and slow) and a histogram that measures the distance between them. When the MACD line crosses above the signal line, it’s a potential sign to buy; conversely, a cross below may suggest a selling point. However, you must be on alert for false signals, which can mislead even seasoned traders.
Stochastic Oscillator
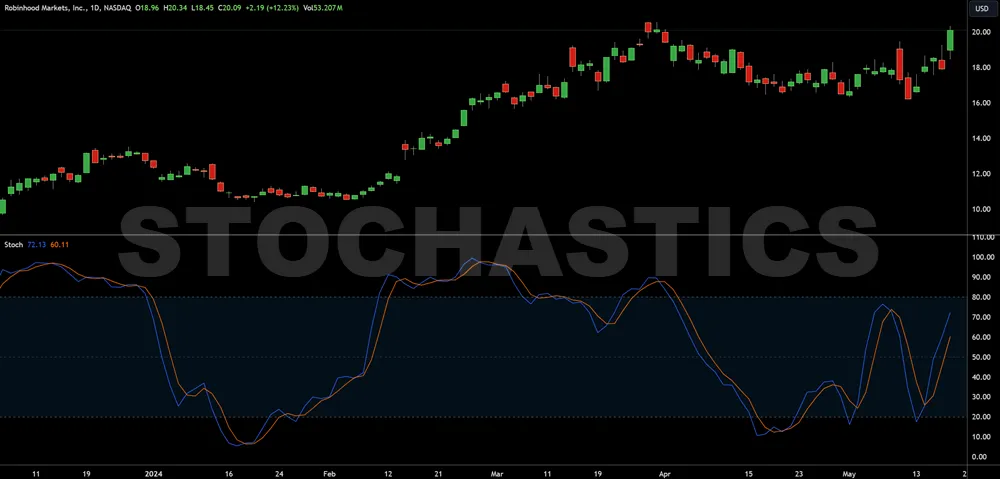
You’ll find the Stochastic Oscillator invaluable for identifying overbought and oversold levels, signaling potential market reversals with its two main components: %K and %D lines. It was one of my favorite trading indicators when I started around 2007.
This oscillator contrasts with others like the Moving Average Convergence Divergence (MACD) by focusing on the position of a closing price relative to its high-low range over a specific period.
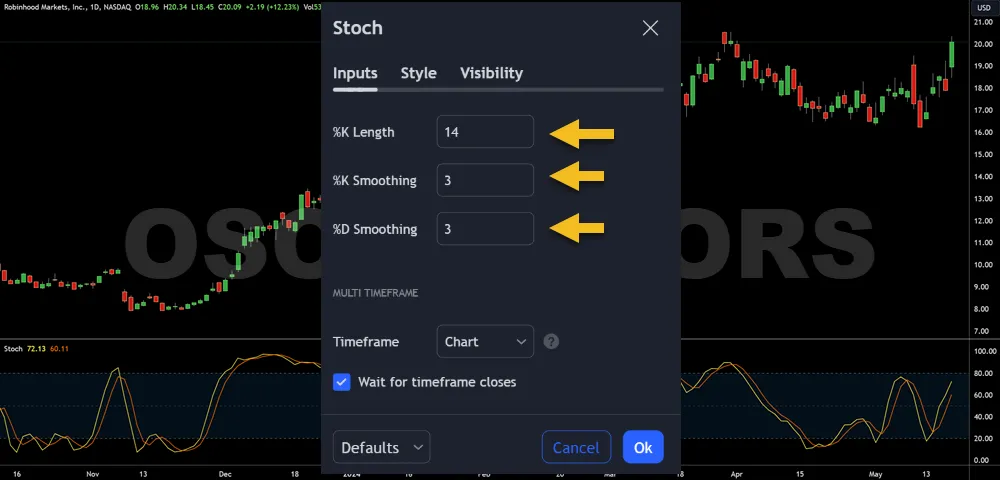
- %K Line Calculation: Fast indicator reacting to market movements.
- %D Line: Smoothed version of %K, using a simple moving average.
- Crossover Signals: %K crossing %D indicates potential trade entry or exit points.
- Effectiveness in Choppy Markets: Particularly useful in sideways or range-bound markets.
- Comparison with ADX and AO: Unlike ADX or Awesome Oscillator, it excels in less trending, more volatile environments.
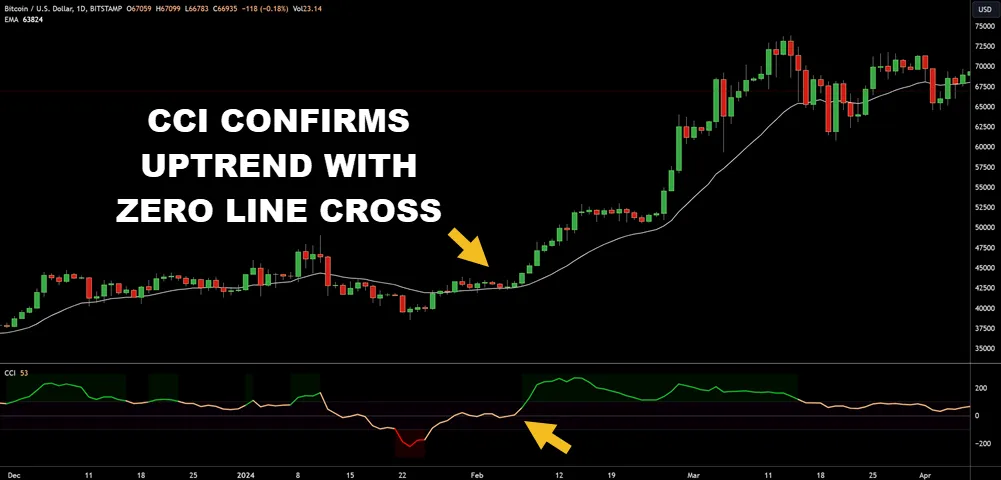
Commodity Channel Index (CCI)
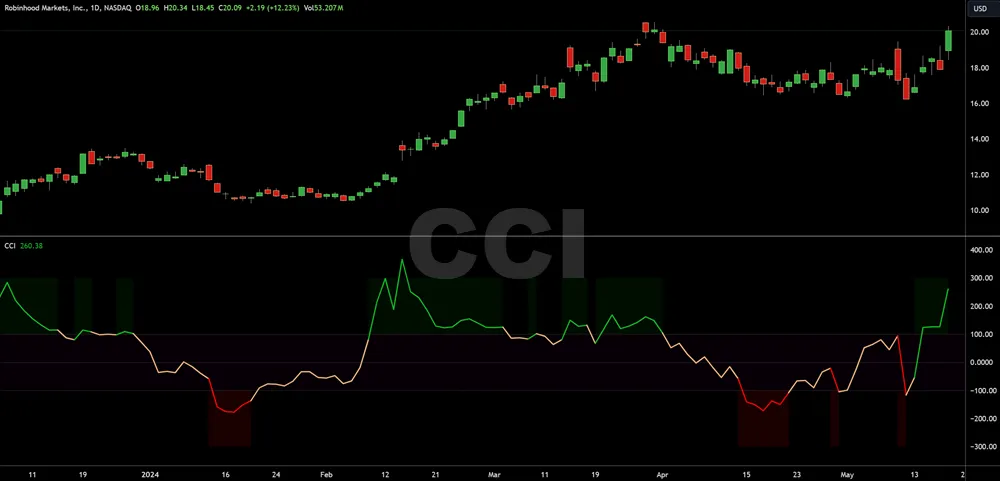
The Commodity Channel Index (CCI), is designed to identify cyclical trends in commodities through a detailed analysis of their price deviations from a statistical mean.
Unlike the Awesome Oscillator (AO), which assesses market momentum, the CCI focuses on the degree to which prices diverge from their average value, offering insights into high-volatility markets where this divergence is often pronounced.
It’s particularly useful when combined with moving average crossovers to confirm trend directions and optimize entry and exit points.
For risk management, monitoring the CCI helps you gauge when a commodity is entering overbought or oversold territories, allowing for strategic decision-making to maximize gains while minimizing potential losses in a dynamic market environment.
Interpreting Oscillator Signals
To effectively interpret oscillator signals, you must understand key indicators such as overbought and oversold conditions. Analyzing divergences and convergences provides insights into potential market reversals, enhancing your strategic decision-making.
Additionally, recognizing crossovers and signal lines can guide your entry and exit points in trading, optimizing your positions based on precise, real-time data.
Overbought and Oversold Conditions
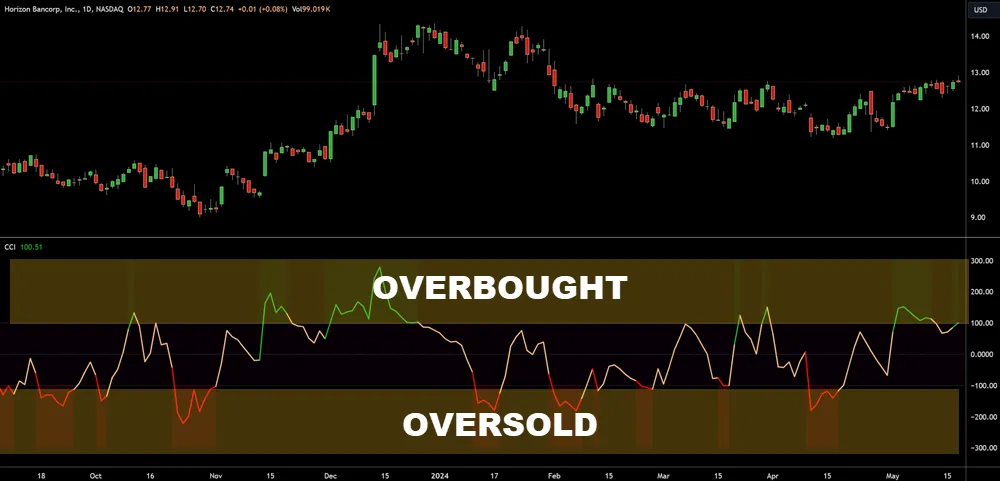
When analyzing oscillator signals, it’s imperative to understand that overbought and oversold conditions indicate potential market turning points. These pivotal moments are often signaled by tools like the Relative Strength Index (RSI), the Commodity Channel Index (CCI), and the Awesome Oscillator (AO). Recognizing these signals can help you assess market sentiment and anticipate shifts in bullish and bearish trends.
Here are key points to keep in mind:
- RSI above 70 often suggests an overbought condition.
- RSI below 30 indicates potential oversold scenarios.
- High CCI values show overbought levels, hinting at a price top.
- Low CCI values suggest oversold conditions, possibly near a price bottom.
- AO peaks can signal exhaustion in current trends, hinting at reversals.
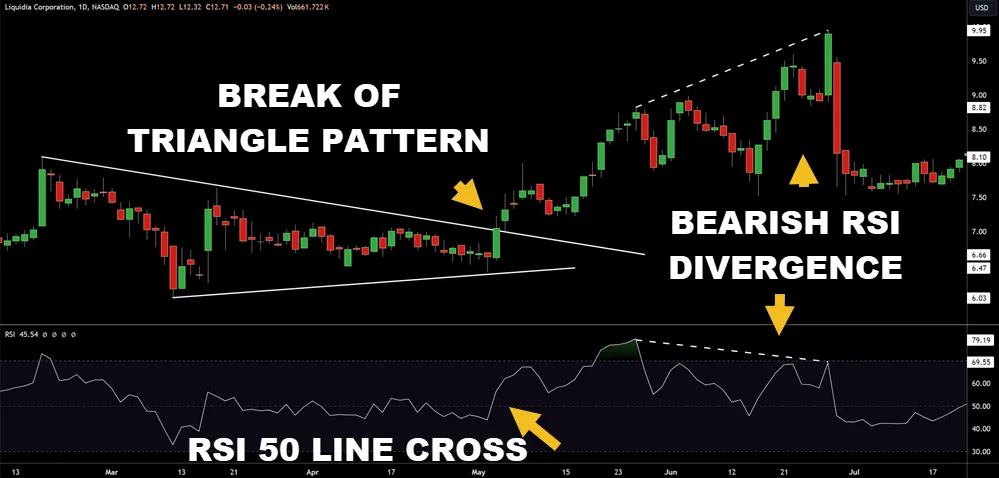
Divergences and Convergences
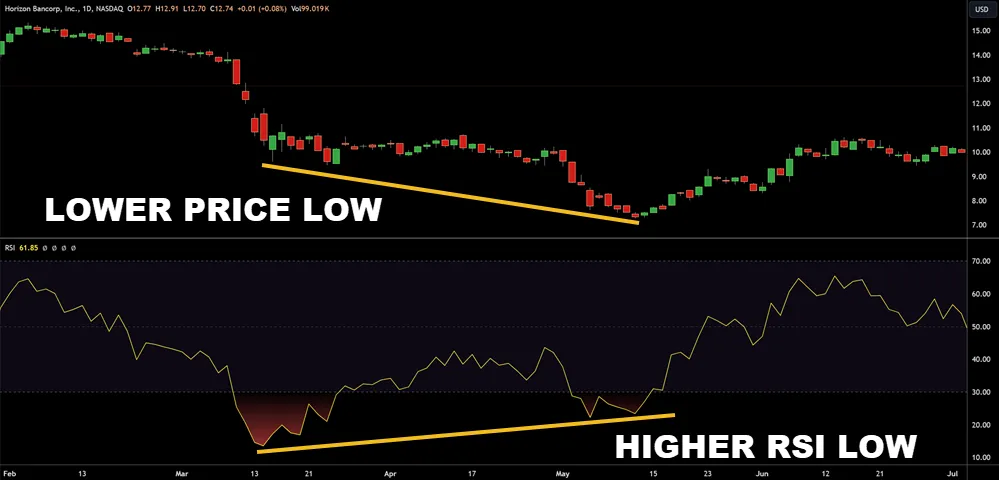
Understanding divergences and convergences in oscillator readings is essential for you to accurately predict potential trend reversals in trading markets. It’s not a guarantee of a reversal but it is useful information.
Divergences occur when, for example, the price of an asset reaches a new high but the Relative Strength Index (RSI) doesn’t confirm this high, suggesting a possible reversal.
Convergences happen when the RSI and price action confirm each other’s movements, indicating continued momentum.
Adding the Commodity Channel Index (CCI) and Awesome Oscillator (AO) into your analysis can refine these predictions.
Utilizing multiple timeframe analyses enhances the reliability of these signals by confirming trends and potential reversals across different time scales, providing a robust framework for your trading decisions.
Accurate interpretation of these indicators is key to optimizing your trading strategy.
Crossovers and Signal Lines
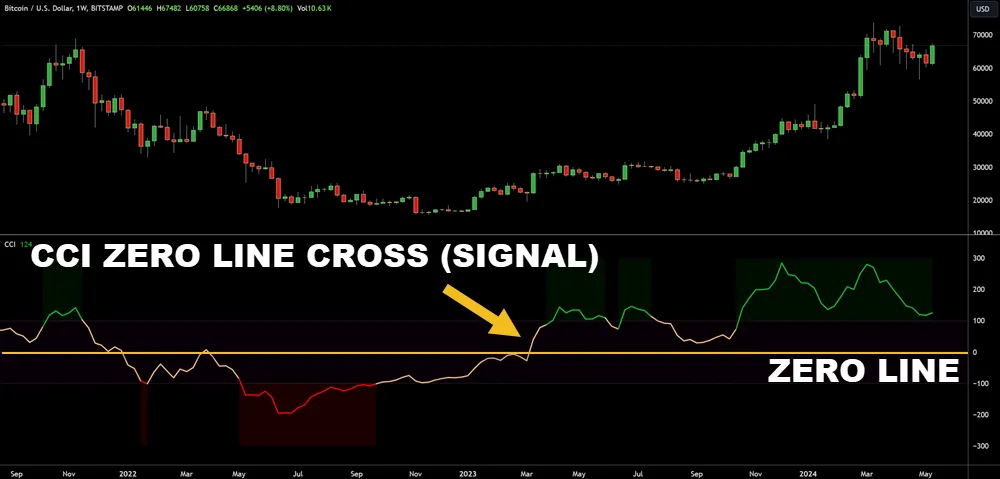
Crossovers between an oscillator’s signal line and its price line can signal upcoming shifts in market momentum, providing a critical tool for your trading strategy.
Understanding these crossovers in oscillators like the Relative Strength Index (RSI), Commodity Channel Index (CCI), and Awesome Oscillator (AO) enhances your analysis, aligning it with both fundamental analysis and technical patterns such as horizontal price channels.
Key points to observe include:
- RSI Crossovers: Indicative of overbought or oversold conditions.
- CCI Reactions: Highlight divergences from normal trading ranges.
- AO Shifts: Detect changes in market driving force.
- Integration with Channels: Confirm trend strength or weakness.
- Fundamental Context: Align oscillator readings with economic indicators for robust decisions.
Advantages and Limitations
They are invaluable for identifying potential trend reversals, offering a statistical edge when forecasting market movements. However, they must be used in conjunction with other technical indicators to confirm these predictions, ensuring a robust trading strategy.
The limitations become obvious when oscillators generate false signals during range-bound market conditions, highlighting the need for careful analysis and the ability to understand simple chart patterns.
Identifying Potential Trend Reversals
Oscillators like the Relative Strength Index (RSI), Commodity Channel Index (CCI), and Awesome Oscillator (AO) provide critical data points that, when interpreted correctly, offer valuable insights into market dynamics.
While these tools are powerful, understanding their full potential requires recognizing both their advantages and their limitations.
- RSI: Measures the speed and change of price movements, aiding in identifying overbought or oversold conditions.
- CCI: Helps identify new trends or cyclical reversals by measuring the variation from the statistical mean.
- AO: Gauges market momentum and possible reversal points through the simple moving average.
- Position Sizing: Adjust your position based on oscillator signals to manage risk.
- Data Interpretation: Skillful reading of these indicators is critical, as misinterpretations can lead to misleading conclusions about reversals.
Confirming Other Technical Indicators
When you’re using oscillators as part of your trading strategy, understand that they can generate false signals in strongly trending markets. These tools are inherently lagging, meaning they often indicate a trend reversal or entry point after the move has begun.
To mitigate this, you should use oscillators along with other technical indicators, increasing the reliability of the signals received.
False Signals in Strong Trending Markets
In strong trending markets, oscillators often generate false signals, necessitating the use of additional technical indicators to confirm trends and avoid misleading trading decisions. Your instrument can stay overbought or oversold for a long time before any reversal.
- Moving Averages: Helps smooth price data to verify trends.
- MACD: Confirms trend direction and momentum.
- RSI Divergence: Identifies potential trend reversals.
- Volume Indicators: Validates the strength behind a trend.
- Bollinger Bands: Offers insights into market volatility.
Lagging Nature of Oscillators
Although oscillators are lagging, they effectively confirm signals from other technical indicators, enhancing your trading strategy’s precision.
By cross-verifying oscillator readings with an indicator like moving averages or trend lines, you’re not just relying on single-source data.
This multidimensional analysis reduces risk and increases the likelihood of pinpointing accurate entry and exit points, optimizing your potential gains in both stable and volatile market conditions.
Incorporating Oscillators into Your Trading Strategy
To optimize your trading strategy using oscillators, you’ll want to use them with other analytical tools such as trend lines and volume indicators.
Adjust the oscillator’s settings to match your trading style and the specific market conditions you’re targeting, ensuring that the sensitivity and signals align with your risk tolerance.
By incorporating effective risk management and position sizing, you can better control potential losses and maximize gains from your oscillator-based trades.
Combining with Other Forms of Analysis
Oscillators aren’t standalone tools; they’re most effective when used as part of a holistic analytical framework.
Here’s how you can integrate them effectively:
- Trend Confirmation: Use oscillators to confirm the strength of a trend identified by moving averages or trendlines.
- Volume Verification: Cross-check oscillator signals with volume increases to validate momentum changes.
- Price Patterns: Combine oscillators with price pattern analysis to pinpoint entry and exit points.
- Resistance and Support Levels: Use oscillators to detect potential reversals near key price levels.
- Market Sentiment: Analyze oscillator divergences alongside market sentiment indicators to gauge potential shifts.
Adjusting Settings to Suit Your Style
Adjusting the settings of your oscillators to match your trading style can greatly enhance their effectiveness. For instance, if you’re a day trader, you might tweak the period settings to be shorter, capturing more immediate price movements.
Long-term traders should lengthen these periods to filter out market ‘noise’ and focus on significant trends.
Analyzing historical data is essential. You’ll want to back-test various settings against past market conditions to identify which parameters align best with successful trades. This approach is data-driven: you adjust based on empirical evidence, not guesswork.
Remember, each asset might respond differently to oscillator settings due to its unique volatility and trading volume patterns. Always adjust your approach to the specific characteristics of the asset you’re trading.
Risk Management and Position Sizing
Managing risk and sizing positions accurately are critical when utilizing oscillators to enhance your trading strategy. Oscillators, when applied correctly, can sharpen your market entry and exit points but must be integrated with solid risk management practices to preserve and grow your capital.
Here are key elements to contemplate:
- Set Stop-Loss Orders: Establish strict stop-loss orders based on the oscillator’s signals to limit potential losses.
- Calculate Risk-Reward Ratios: Aim for trades where the potential reward justifies the risk, ideally a ratio of at least 1:3.
- Adjust Leverage: Use lower leverage to reduce risk exposure, especially in volatile markets.
- Diversify Trades: Don’t rely solely on one instrument or market; diversify to spread risk.
- Monitor Volatility: Adapt your position sizes based on the current market volatility, which oscillators can help identify.
Advanced Oscillator Techniques
Consider taking the time to master multiple timeframe analyses. This approach aligns oscillators across various time spans to pinpoint more precise entry and exit points.
Customizing oscillator parameters allows you to tailor indicators to reflect your specific trading style and risk tolerance, enhancing strategy effectiveness.
These advanced techniques provide a robust framework for interpreting market dynamics and optimizing your decision-making process.
Multiple Timeframe Analysis
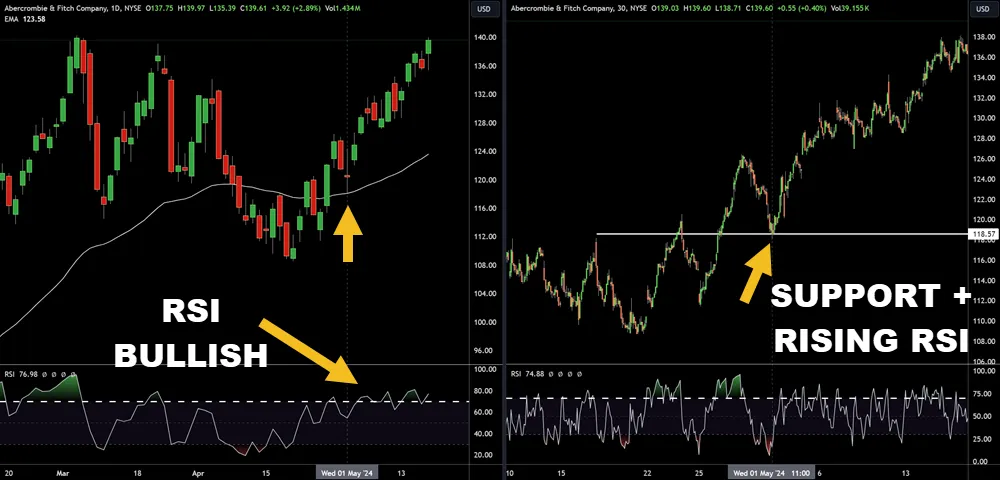
Using multiple timeframe analysis enhances your oscillator strategy by providing a layered perspective on the market. This method allows you to gain insights from various periods, refining your entry and exit points in trading. Here’s how you can use this approach:
- Identify Trends: Use longer timeframes to determine the overall market trend.
- Signal Confirmation: Shorter timeframes can confirm buy or sell signals detected on medium frames.
- Risk Management: Adjust stop-loss and take-profit levels based on information from multiple timeframes.
- Momentum Assessment: Cross-verify momentum oscillators across different periods to gauge the strength of the trend.
- Divergence Detection: Spot potential reversals earlier by noting divergences in shorter versus longer timeframe charts.
Customizing Oscillator Parameters
This is an advanced stage of technical analysis where you start customizing oscillator parameters to match market conditions.
Adjusting sensitivity and smoothing settings can greatly refine your trading strategies by reducing noise and increasing signal reliability.
Adapting these parameters to current market volatility guarantees that your oscillator remains responsive and accurate, crucial for real-time decision-making.
Sensitivity and Smoothing Adjustments
Adjusting the sensitivity and smoothing parameters in oscillators can greatly refine your trading signals, enhancing both accuracy and responsiveness. Consider these precise adjustments:
- Increase Sensitivity: Capture quicker market movements.
- Reduce Sensitivity: Filter out market “noise.”
- Shorter Smoothing Periods: Sharpen indicator reactions.
- Longer Smoothing Periods: Obtain smoother data trends.
- Optimize Parameters: Regularly test and adjust settings to maintain optimal performance.
Adapting to Market Volatility
After refining oscillator settings for better accuracy, it’s imperative to adapt these tools to varying market volatility levels.
You should modify the sensitivity of oscillators during high-volatility periods to reduce signal noise and false positives.
In low-volatility scenarios, increase sensitivity to detect smaller and less obvious price movements.
This dynamic approach guarantees you’re responding accurately to real market changes, enhancing your trading strategy’s effectiveness.
Oscillators in Different Market Conditions
You’ll find that oscillators behave distinctly in range-bound, trending, and choppy market conditions.
In range-bound markets, oscillators such as the RSI or Stochastic can help identify overbought or oversold levels, suggesting potential reversal points.
During strong trends, these indicators may remain in overbought or oversold territories for extended periods, challenging the reliability of traditional oscillator-based strategies.
Range-Bound Markets

In range-bound markets, oscillators can be used for identifying potential buy and sell signals during lateral price movements. You’ll find their accuracy in pinpointing market extremes—both oversold and overbought conditions—particularly useful. This is essential for capitalizing on price fluctuations within a defined range.
- Relative Strength Index (RSI): Helps identify overbought (>70) or oversold (<30) conditions.
- Stochastic Oscillator: Useful for highlighting potential reversal points by comparing a closing price to its price range.
- MACD: Signals changes in the strength, direction, momentum, and duration of a price trend.
- CCI (Commodity Channel Index): Measures a security’s variation from its statistical mean.
- Williams %R: Mirrors stochastic but with an inverted scale; identifies overbought and oversold levels.
Trending Markets
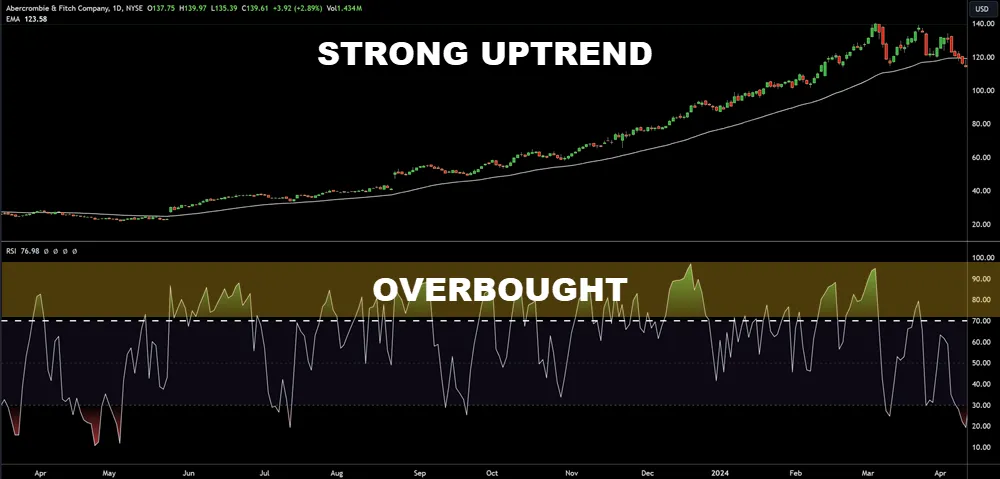
While oscillators prove highly effective in range-bound markets, their role shifts considerably when applied to trending markets. In these conditions, traditional oscillators like RSI and Stochastics often mislead with frequent, yet false, overbought or oversold signals. In strong uptrends, oscillators may remain in overbought zones for extended periods, signaling a potential reversal that doesn’t materialize. Conversely, during downtrends, they can stay oversold, suggesting a bullish reversal that never occurs.
You’ll find that modifying the oscillator parameters can enhance their effectiveness in trending environments. Increasing the period of these tools reduces sensitivity, leading to fewer, but more reliable signals. This adjustment helps mitigate the risk of misinterpreting market momentum and improves your strategic positioning for long-term trends.
Choppy and Volatile Markets
Oscillators can be challenging to interpret in choppy and volatile markets, where rapid price changes often produce misleading signals. You need to adjust your strategies to filter out the noise and capture the true market sentiment.
Here’s how you can enhance your oscillator analysis:
- Increase the period: Lengthening the oscillator’s timeframe can smooth out erratic movements.
- Combine with other indicators: Use tools like moving averages to confirm trends.
- Focus on extremes: Only consider signals that reach extreme overbought or oversold levels.
- Apply multiple oscillators: Cross-check with different oscillators to validate signals.
- Backtest strategies: Regularly test your approach to make certain it remains effective under current market conditions.
These strategies will help you navigate the complexity of volatile markets more effectively.
Frequently Asked Questions
How Do Oscillators Compare to Moving Averages in Trend Analysis?
Oscillators and moving averages serve different purposes in trend analysis.
You’ll find oscillators like RSI or Stochastics useful for identifying overbought or oversold conditions, often foreshadowing reversals.
Moving averages help you determine the direction and strength of a trend over time by smoothing past price data.
While oscillators provide insights into market momentum, moving averages offer a clearer view of longer-term trend stability.
Combining both can enhance your analysis accuracy.
Can Oscillators Predict Stock Price Crashes?
No, they aren’t foolproof for predicting such events. Oscillators are tools that help identify overbought or oversold conditions, not necessarily impending crashes.
While they can signal potential reversals, utilize them alongside other indicators and market analysis to enhance accuracy. Relying only on oscillators might lead to misleading conclusions, so it’s essential to take into account a broader range of data.
What Are Common Mistakes When Using Oscillators?
When you use oscillators, a common mistake is misinterpreting overbought or oversold levels as immediate buy or sell signals. You might also overlook the oscillator divergence, which can be a crucial indicator of potential reversals.
Relying solely on oscillators without considering other market factors or broader trends often leads to inaccurate predictions. It’s essential to integrate oscillator data with other analytical tools to enhance the accuracy of your trading decisions.
How Do Interest Rates Affect Oscillator Performance?
Interest rates greatly impact oscillator performance in trading. When rates rise, it typically leads to decreased market liquidity, affecting oscillator indicators like RSI or MACD, which may show less volatility.
Conversely, lower rates often boost market liquidity, enhancing oscillator sensitivity and creating more trading signals. You’ll notice oscillators reacting more sharply to price movements in such environments, offering clearer insights for your trading decisions.
Are Oscillators Suitable for Day Trading Only?
Oscillators aren’t just for day trading; you can use them in various time frames. They’re tools that help identify potential reversals by comparing price momentum with market conditions.
When you’re trading on longer time scales, oscillators can signal overbought or oversold conditions, offering strategic entry and exit points.
You should analyze historical data and adjust oscillator settings to align with your specific trading strategy for optimal results.
Conclusion
As you’ve seen, oscillators play a vital role in enhancing your trading strategy. By accurately interpreting their signals, you can gauge market momentum and make well-informed decisions.
Remember, while they offer significant advantages, their effectiveness can vary across different market conditions. Integrate them judiciously, aligning with other analytical methods for robust strategy formulation.
Continually refine your techniques and stay updated with market shifts to optimize your trading outcomes using oscillators.