
- May 8, 2024
- Posted by: Shane Daly
- Categories: Trading Article, Trading Indicators

Bollinger Bands are a powerful tool that can help you trade any market with precision and confidence. In this article, we’ll look into five proven methods to maximize your success using Bollinger Bands.

You’ll discover how to:
- Identify trends and potential reversals
- Adapt strategies to different markets
- Combine Bollinger Bands with other technical indicators
- Master specific techniques like the squeeze and breakout
- Develop a comprehensive trading plan
Whether you’re a novice trader or a seasoned pro, these insights will provide you with an edge to optimize your trading outcomes with BB.
Main Points
- Utilize Bollinger Bands to identify market trends and reversals, adjusting settings based on market volatility.
- Combine Bollinger Bands with RSI or MACD to confirm trading signals and enhance decision accuracy.
- Employ Bollinger Band strategies like the squeeze and breakout to capitalize on market momentum.
- Implement a solid risk management strategy, setting precise stop-loss and take-profit points.
- Continuously backtest and refine trading strategies to adapt to changing market conditions and optimize performance.
What Are Bollinger Bands

Bollinger Bands were developed by John Bollinger in the 1980s. These bands incorporate a simple moving average with two standard deviations plotted away from this average, forming what’s known as the band calculations.
Essentially, they adapt to volatility in the market, tightening during less volatile periods and expanding during more volatile ones. This dynamic adjustment is important as it reflects the real-time market conditions, allowing you to make decisions based on the state of the instrument.
5 Effective Strategies For Trading With Bollinger Bands
In this section, we’ll explore five proven strategies that use Bollinger Bands to improve your trading accuracy and potential win rate. You’ll discover how band width analysis can provide insights into market volatility, enabling you to make decisions about entry and exit points.
We’ll look at volatility assessment techniques that help identify periods of low and high market activity, which are key to optimizing your trading strategy. You’ll learn how to use price channeling to spot potential breakout points before they happen, giving you a strategic edge.
1. Identify Trends and Potential Reversals

You can utilize Bollinger Bands to pinpoint the onset of emerging trends and the likelihood of upcoming reversals. By observing the bands’ expansion, you’re alerted to increased market volatility and potential trend shifts.
Conversely, a contraction signals reduced volatility and often precedes market consolidation or reversal.
Identify trends and potential reversals
Bollinger Bands can provide you with critical signals about overbought and oversold conditions when prices touch or exceed the upper and lower bands, respectively. Analyzing these points helps you predict potential market reversals by signaling when the price may snap back to the median (mean reversion).
You must understand how to interpret these occurrences across varying market scenarios to enhance your trading strategy.
Overbought and oversold conditions
When prices consistently touch or surpass the upper Bollinger Band, it often signals an overbought condition, suggesting a potential trend reversal.
Conversely, touching or breaking below the lower band indicates oversold conditions.
You should perform Band Width Analysis, assess volatility, and observe price consolidation patterns, which provide crucial data for interpreting these market signals accurately.
How to interpret these signals in different market conditions
In different market conditions, Bollinger Bands can help you spot emerging trends and signal potential reversals by analyzing how prices interact with the bands. Mastering market volatility analysis, signal confirmation techniques, and entry point timing will improve your trading strategy.
| Condition | Signal Example | Interpretation |
|---|---|---|
| High Volatility | Band Widening | Price consistently near the top band |
| Trending Market | Price consistently near top band | Consider long positions |
| Reversal Imminent | Price crossing the middle band | Reevaluate or adjust positions |
2. Adapt Bollinger Band Strategies to Different Markets
You’ll find that Bollinger Bands aren’t just for stocks; their adaptability extends to forex and cryptocurrencies as well. Each market’s volatility and trading volume influence how you should adjust the standard deviation settings and the moving average period.

Versatility of Bollinger Bands across stocks, forex, and cryptocurrencies
You’ll find that Bollinger Bands adapt effectively to various market environments, whether you’re trading stocks, forex, or cryptocurrencies.
Each market possesses distinct volatility and trend behaviors, necessitating tailored approaches to maximize the utility of Bollinger Bands.
Understanding these market-specific dynamics guarantees that your strategies are both precise and effective.
How to adapt strategies to each market’s unique characteristics
Adapting Bollinger Band strategies to distinct markets like stocks, forex, and cryptocurrencies maximizes their effectiveness by leveraging unique market volatilities and trends.
You’ll need to take into account market liquidity, which affects how bands adjust to price changes.
Sector-specific behaviors in stocks may dictate tighter settings, while forex traders may want more flexibility due to constant market shifts.
Cryptocurrencies require frequent time frame adjustments due to extreme volatility.
Understanding market-specific dynamics when applying Bollinger Bands
Understanding the specific dynamics of each market is essential when applying Bollinger Bands, as this improves the strategy’s effectiveness by aligning with the inherent volatility and trading volume of stocks, forex, or cryptocurrencies.
- Market volatility analysis: Tailor bandwidth settings for high volatility periods (testing needed).
- Sector-specific patterns: Recognize unique behaviors in different sectors.
- Timeframe variability: Adjust timeframes based on market speed.
- Liquidity considerations: Adapt for market depth.
- Economic indicators: Align trading signals with economic releases.
3. Combine Bollinger Bands with Other Technical Indicators
To enhance your trading strategy using Bollinger Bands, you should consider integrating them with other technical indicators like RSI, MACD, and the Stochastic Oscillator. These tools, when combined, offer a more robust analysis by confirming trends and signaling potential reversals with greater accuracy.
You’ll find that each indicator complements the Bollinger Bands by providing additional data points to substantiate your trading decisions.
Introduce popular complementary indicators (RSI, MACD, Stochastic Oscillator)

When you combine Bollinger Bands with indicators like RSI, MACD, and the Stochastic Oscillator, you’re better equipped to confirm trading signals and minimize false positives.
This multi-indicator approach enhances your strategy’s reliability, providing a robust method to gauge market momentum and potential reversals.
In the example above, the MACD (standard settings) shows declining momentum as price is in the overbought territory of the Bollinger Bands. This may lead a trader to consider a short trade.
Combining Bollinger Bands with indicators like RSI, MACD, and Stochastic Oscillator can enhance your trading strategy by confirming signals and minimizing the risk of false positives.
- Indicator Reliability: Improved by cross-referencing divergences and convergences.
- Signal Timing: More precise entry and exit points.
- Integration Challenges: Requires understanding of each indicator’s mechanics.
- Data-Driven Decisions: Strengthens analysis with multiple data points.
- Reduced False Positives: Filters out noise, focusing on significant movements.
Provide step-by-step examples of how to integrate these indicators with Bollinger Bands
How can you effectively integrate Bollinger Bands with RSI, MACD, and Stochastic Oscillator to enhance your trading strategy?
| Step | Indicator | Action |
|---|---|---|
| 1 | RSI | Customize thresholds based on historical analysis |
| 2 | MACD | Align MACD crossovers with band breaches |
| 3 | Stochastic | Use overbought/oversold levels to confirm swings |
| 4 | Algorithmic | Integrate all indicators in an automated system |
This integration maximizes precision and reduces risks.
4. Master Specific Bollinger Band Strategies
You’ll find that mastering specific Bollinger Band strategies can greatly enhance your trading efficacy.
For instance, using the Bollinger Band Squeeze helps you capitalize on periods of low volatility, indicating potential upcoming market moves.
Understanding Bollinger Band Breakouts and Walks allows you to identify and exploit price movements as they breach or ride the bands during strong trends.
Bollinger Band Squeeze: taking advantage of low volatility periods
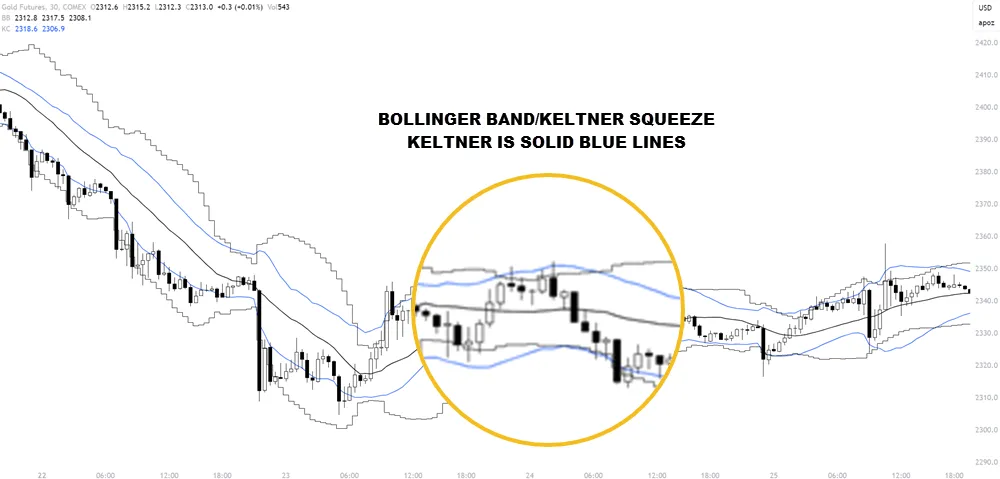
You’ll first need to recognize the Bollinger Band Squeeze, which signals a period of low volatility indicated by the bands tightening closely around the price and entering the Keltner channel.
When trading this pattern, it’s important to set precise entry and exit points as price breaks from the squeeze to manage risks effectively and target potential profits.
How to identify and trade the squeeze pattern
To capitalize on the Bollinger Band Squeeze, you must first identify when the bands are noticeably closer together, indicating a period of lower market volatility.
- Volatility Measures: Track historical volatility trends to predict squeeze scenarios.
- Chart Settings: Adjust your chart to include a 20-period moving average and standard deviation settings.
- Keltner Channel: Use 20-period moving average and 1.5 ATR
- Entry Points: Look for a breakout from the squeeze.
- Exit Points: Set clear profit targets and stop-loss orders.
Bollinger Band Breakouts: entering trades when price breaks through upper or lower bands
When you’re identifying Bollinger Band breakouts, learn to distinguish genuine signals from potential false breaks.
You’ll need techniques to confirm breakouts; this guarantees you’re not prematurely entering or exiting trades based on random price movements.
Additionally, setting precise stop-loss and take-profit levels will help you manage risk and secure profits.
Techniques for confirming breakouts and avoiding false signals
Mastering Bollinger Band breakouts requires you to confirm price movements beyond the bands with additional indicators, ensuring you avoid false signals and enter trades based on reliable data.
- Volume Analysis: Confirm breakout strength with increased trading volume.
- Candlestick Patterns: Identify bullish or bearish formations post-breakout.
- Momentum Indicators: Use RSI or MACD to detect momentum shifts.
- Trend Confirmation: Check alignment with the overall market trend.
- Time Frames: Cross-verify signals across different periods.
Setting appropriate stop-loss and take-profit levels
To optimize your trading outcomes, set precise stop-loss and take-profit levels after entering Bollinger Band breakouts.
Establish profit target efficiency by identifying psychological thresholds (round numbers, support/resistance zones) that might prompt price reversals.
Bollinger Band Walks
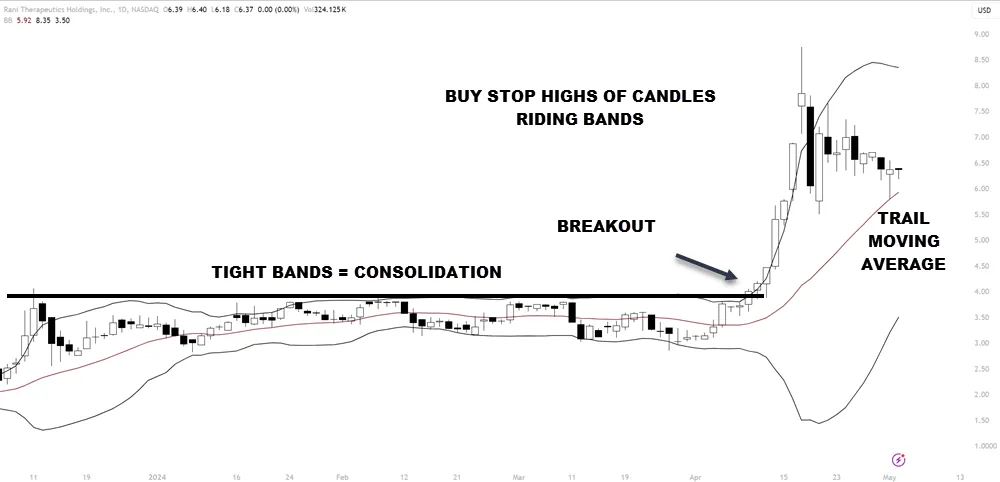
When you observe a strong trending market, Bollinger Band walks can be a powerful strategy when traded with discipline.
Ensure you apply rigorous risk management when you’re entering multiple positions; this minimizes potential losses while capitalizing on the trend’s momentum.
Analyzing past trends and their duration helps you optimize entry and exit points, ensuring a more tuned approach to multi-position trades.
Strategies for identifying and capitalizing on strong trending markets
Bollinger Band Walks enable you to capitalize on strong trending markets by entering multiple positions as the price adheres closely to the moving bands.
- Volatility Analysis: Assess market volatility to predict the sustainability of trends.
- Momentum Indicators: Utilize tools like RSI to confirm trend strength.
- Trend Duration: Monitor the persistence of price walking the bands.
- Entry Points: Identify optimal moments for trade entry.
- Exit Signals: Recognize when trends begin to weaken.
Risk management considerations for multi-position trades
Managing your risk is essential when you’re entering multiple positions during a Bollinger Band Walk.
Be cautious of leverage effects; excessive use of leverage can amplify losses. Always analyze these factors to optimize your strategy for better risk-adjusted returns.
5. Develop a Comprehensive Bollinger Band Trading Plan
To trade effectively using Bollinger Bands, you’ll need a trading plan that integrates these indicators.
You should consider the advantages of both backtesting your Bollinger Band strategies to validate historical efficacy and forward testing to confirm they hold up in real-time market conditions.
This dual approach will help you refine your strategies and increase your trading precision.
Importance of a well-defined trading plan incorporating Bollinger Bands
To optimize your trading outcomes using Bollinger Bands, integrate key components into your trading plan. These components include risk management, entry and exit rules, and appropriate position sizing. You must also adapt your strategy to align with market conditions and your personal risk tolerance to maintain robustness.
This approach will help mitigate potential losses and enhance profitability in your trading activities.
Key components of a successful trading plan (risk management, entry/exit rules, position sizing)
When developing a trading plan that incorporates Bollinger Bands, focus on key components such as risk management, entry and exit rules, and position sizing.
- Risk Management: Set stop-loss orders based on volatility.
- Entry Rules: Enter trades when the price touches the lower Bollinger Band.
- Exit Rules: Exit when the price hits the upper band.
- Position Sizing: Adjust size based on market sentiment.
- Execution Speed: Optimize for rapid trade execution.
Adapting the plan to different market conditions and personal risk tolerance
Adapting your trading plan to different market conditions and personal risk tolerance is important for maximizing the effectiveness of Bollinger Bands.
Use diversification techniques to mitigate risks and adapt portfolio adjustment strategies based on performance data that you amass over time.
This precise, analytical approach guarantees you’re not just reacting to market changes but proactively managing your strategy.
Benefits of backtesting and forward-testing Bollinger Band strategies
When you backtest Bollinger Band strategies, you’re essentially running simulations using historical data to gauge potential performance. This process helps you optimize your trading approach by identifying which settings have historically led to success.
Forward testing, or paper trading, then allows you to test these optimized strategies in real-time market conditions, ensuring continuous refinement and adaptation of your trading plan.
Techniques for optimizing strategies based on historical data and live market performance
To optimize your Bollinger Band trading strategy, you should not only backtest with historical data but also forward testing in live market conditions. Here are key techniques:
- Data normalization: Guarantee consistent data input quality.
- Performance benchmarking: Compare results against market standards.
- Algorithmic adjustments: Fine-tune parameters based on outcomes.
- Risk assessment: Evaluate potential losses.
- Strategy validation: Confirm reliability through repeated trials.
Continuous refinement and adaptation of the trading plan
As you develop a thorough Bollinger Band trading plan, continuously refining and adapting your strategy is needed to maintain its effectiveness in varying market conditions.
Use market feedback analysis to gauge real-time effectiveness, engage in plan performance evaluation to identify strengths and weaknesses, and conduct strategy stress testing to guarantee resilience.
This approach guarantees your trading plan remains robust and responsive to dynamic market trends.
Frequently Asked Questions
How Do Bollinger Bands Adjust to Sudden Market News?
When sudden market news hits, Bollinger Bands adjust quickly, widening due to increased volatility. This reaction speed captures news impact analysis, highlighting potential volatility spikes that help you gauge the market’s immediate response.
Can Bollinger Bands Predict Stock Prices Accurately?
Bollinger Bands can’t predict stock prices accurately; they’re volatility indicators, useful for trend confirmation and price forecasting within certain limits. You should combine them with other analysis tools for more precise market predictions.
What Are the Limitations of Using Bollinger Bands Alone?
Using Bollinger Bands alone, you’ll face limitations like false signals, overreliance risks, and a dependency on historical data, which might not predict future market movements accurately. Always integrate other analysis tools.
How Often Should I Adjust Bollinger Band Parameters?
You should adjust your Bollinger Band parameters based on trading frequency and market conditions. Regular parameter optimization is essential for maintaining relevance and accuracy in your trading strategy, ensuring optimal responsiveness to market dynamics.
Are Bollinger Bands Effective in Low Volatility Markets?
Bollinger Bands can struggle in low-volatility markets as volatility indicators lose sensitivity. You’ll find market adaptability and strategy efficiency reduced, making it crucial to adjust tactics or integrate additional analytical tools.
Conclusion
By recognizing trends, adapting strategies across markets, and integrating other indicators, you’re equipped to enhance precision in your trades.
Mastering specific techniques and crafting a thorough trading plan are essential. Remember, the key to success lies in the consistent application and analysis of these strategies, ensuring you make data-driven decisions to optimize your trading outcomes.