- January 15, 2019
- Posted by: Shane Daly
- Category: Trading Article

The Awesome Oscillator is another technical indicator designed to measure market momentum on any time frame.
The name “Awesome” may have had you thinking it did something really special when you add it to a trading strategy.
No.
But like any technical indicator, the Awesome Oscillator, when understood, could add something to your present strategy to increase your edge.
What Exactly Is The Awesome Oscillator?
Bill Williams combines two simple moving averages, the 5 period simple moving average and the 34 period simple moving average.
He then has the moving averages calculated by the midpoints of each prior candlestick.
The difference between the two averages is then calculated.
Key point: Notice that Bill decided on using the simple moving average with his Awesome Oscillator. The truth is that the EMA and SMA, while calculated differently, should not make much of a difference for a trading strategy.
Awesome Oscillator Calculation
What I do find interesting is that Bill Williams used the bar midpoint [ (High + Low)/2 ] instead of the standard closing price.
You can see from that calculation that it takes into account the full range of the trading day, which can be important from a volatility stand point.
The Awesome Oscillator is calculated as: SMA (Median price of 5) – SMA (Median price of 34)
Any trading indicator you use should be understood and that includes how the indicator is calculated.
Placing the AO on Your Chart
Virtually all charting platforms should have the AO as a technical indicator you can use. This example is from TradingView.
Here is how to read the Awesome Oscillator
First thing you will notice that unlike other oscillators like the stochastic oscillator, the awesome oscillator uses a histogram instead of a line.
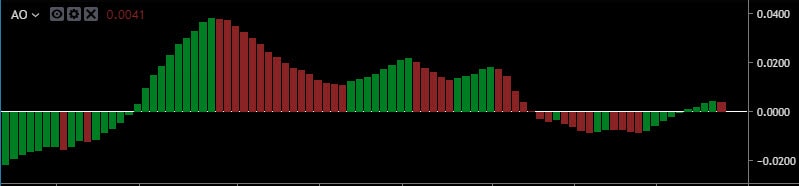
The histogram will either be located above the zero line for short term bullish trend and below the zero line for a bearish outlook.
Looking at it from a moving average standpoint: if the fast average(5) is over the slower average (34), we will be over the zero line and bullish.
If the fast average is below the slower average, we will be below zero and bearish.
Each bar on the histogram will color code green if the current AO bar is higher than the previous. Red will be the color if the bar is lower than the previous.
Awesome Oscillator Strategy #1 – Zero Line Cross
There are several ways to use the AO and the most basic way is looking for a zero line cross.
- Histogram starts below (above) the zero line
- Histogram rises (falls) above (below) the zero line
- We are now bullish (bearish)
- Enter a long (short) position
- Set stop below (above) the last low
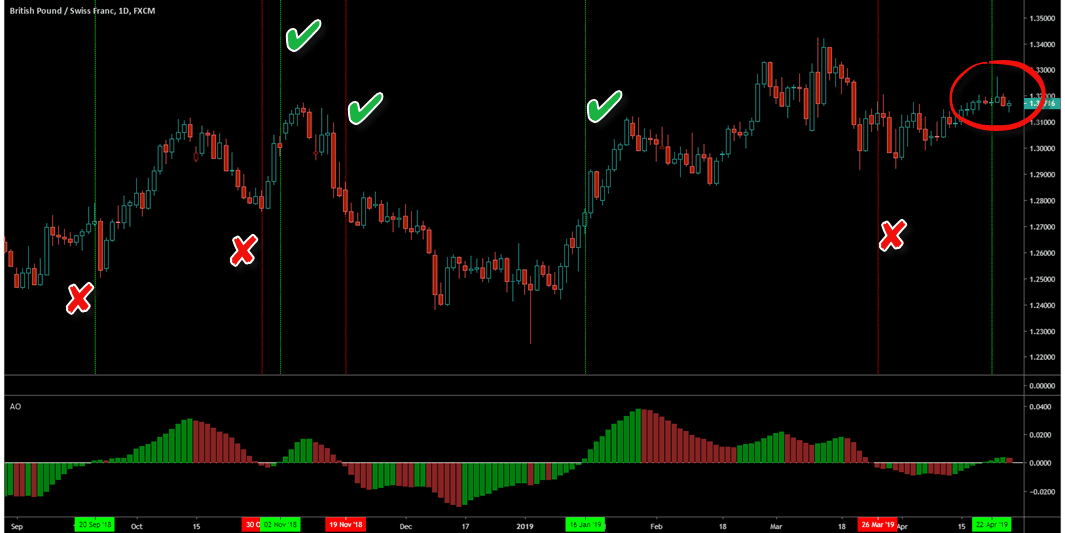
This daily chart of a Forex pair shows 50% of the trades went enough in our favor to execute trade management.
The big issue: we bought at extreme highs and sold at the extreme lows. The awesome indicator is not looking too awesome here, is it?
Keeping in mind that the Awesome Oscillator shows us a change in momentum, is that enough to enter a trade?
No. This type of trading will eventually blow your trading account.
What we can do is add simple price patterns (covered in my free Price Pattern E-Book) to the signals given by the oscillator.
Let’s go back to the previous chart……………….
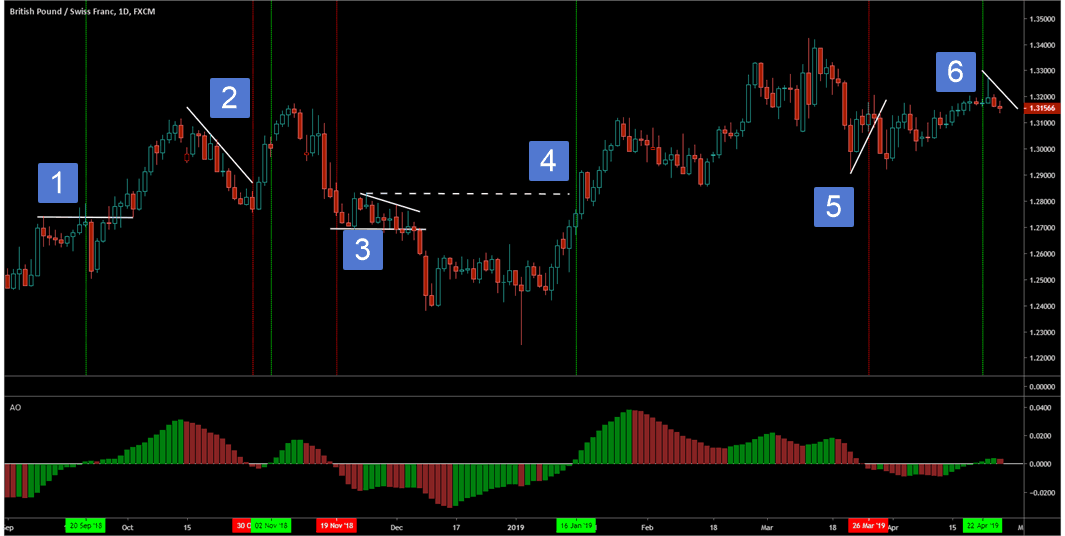
What I have done is used the AO as a momentum trend tool and common price patterns, pullbacks and breakouts, as a means to trade the chart.
- AO has gone bullish with low momentum (small histogram bars) as price ranged. Playing the breakout/pullback as a trade entry
- This is a low volatility pullback in an uptrend. Although AO goes below zero, we have low momentum in the pullback, low momentum in the AO. We can trade the break of the trend line when the AO turns green and not wait for the bullish AO
- Price range with lower highs. Position in the range for a short trade. Earlier entry has you sitting through days of ranging price action
- Dashed white line is prior resistance zone. AO goes bullish before the break. We play the one day pullback after the break of the resistance zone
- Trading a trend line break. This trade would not have worked out better than taking the AO entry.
- Still waiting for the pullback
Although some of these trades had slightly better entries using the zero line cross entry, over a basket of trades you will see using confirmation through simple price patterns will perform at a higher level.
Awesome Oscillator Strategy #2 – Bullish and Bearish Saucer Setup
This strategy combines:
- Bullish or bearish market condition
- Decrease in momentum and a sudden increase in momentum
- Comparing 3 histograms bars
In simple terms, if a market is in a bullish momentum trend, we want to see a decline in momentum via the red histogram for at least 2 bars.
While you may not see an obvious pullback in price during the red bars for a bullish setup, we are getting a pullback in momentum.
Once we see a green bar rise above the previous red histogram bar, we go long. The green bar indicates a return of momentum or an ending of a pullback.
For this example, I want to show how you can use the Awesome Oscillator for day trading especially in volatile markets such as crude oil futures.
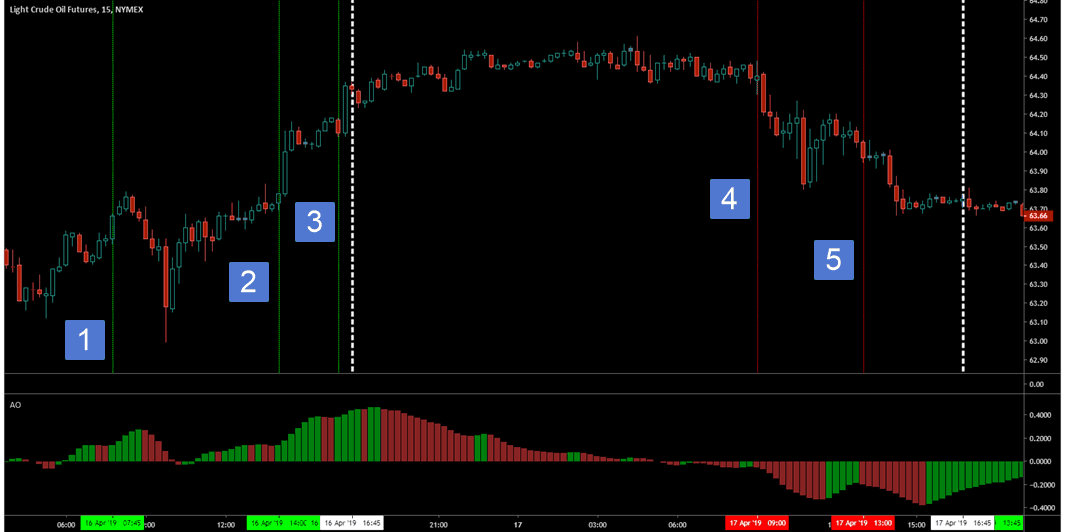 The white lines are the times just before the market closes for an hour between 5 and 6 p.m. eastern time.
- AO has crossed the zero line, we get at least 2 red bars and the green histogram rises above the previous red histogram. That is a long setup and trigger.
- After 3 histogram bars below zero (45 minutes bearish no setup), we return long. We skip the one red histogram and after the two consecutive red bars, the green histogram is our trigger
- This trade happens prior to the hour close. Total positive move this day +70 ticks
- Bearish zero line, two green bars and a red that is lower than the previous green. Short trade.
- 5 green bars and red that is lower for a short trade. Total positive moves this day +86 ticks
How you manage the trade will influence how far you take these trades. Keep in mind the AO saucer strategy still depends on the indicator for trading decisions.
If I had to choose between the saucer setup and the zero line cross, I would take the saucer because it takes into account a pause in the market. From there, explosive moves “can” happen.
Awesome Oscillator Strategy #3 – Twin Peaks Setup
The awesome oscillator trading strategy will take into account momentum swings in the market, trend, as well as elements from the saucer setup.
We are looking for (considering long trades)
- 2 peaks of the AO below the zero line with the second peak higher than the first.
- The gap between the peaks can not rise above the zero line
- On the second peak, we want to see a green bar on the oscillator following the bottom of the peak
- When the oscillator climbs above the zero line, we place our trade long
- Stop goes below the last swing low
- Profit targets can be via 2 consecutive red bars while above the zero line. Also read this trading tips article on taking profits
Short trades would require the Williams Awesome Oscillator to begin on the topside of the zero line which you will see on this Gold chart.
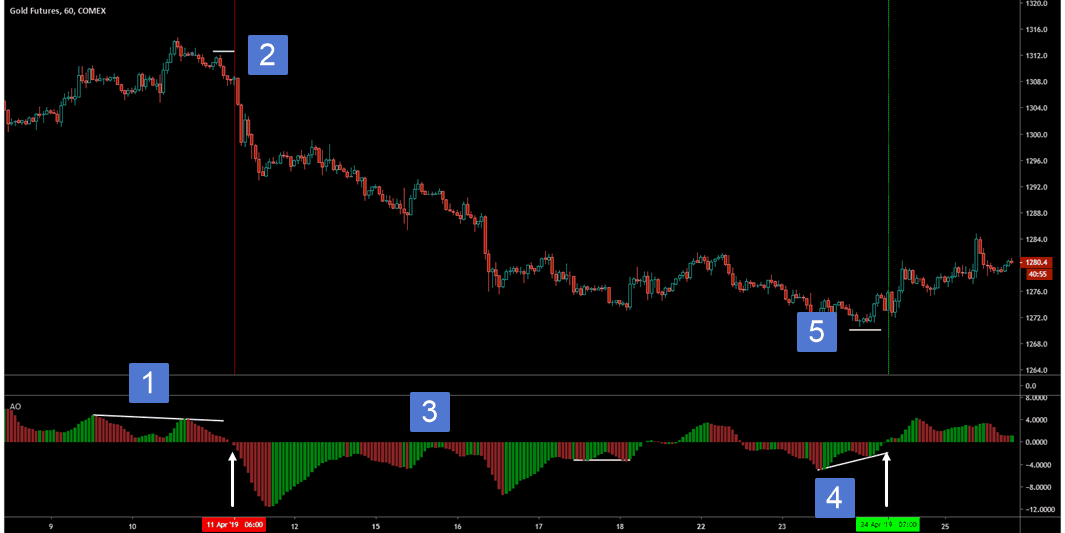
- Short trade. Twin peaks with second one lower and red histogram.
- Arrow shows trade entry as the indicator flips to below the zero line. Stop loss at recent swing high
- We have twin peaks but no break of the zero line
- Below the zero line we have two peaks with the second higher than the first.
- Stop goes below most recent low
The twin peaks strategy uses a shift of momentum for from bullish to bearish along with a double bottom type of setup with the indicator depending on the second peak.
We also have an indication of higher low or lower highs on the indicator (the 2 peaks with one lower or higher than the other) which we have when looking at trending price action. The break of the zero line is the final confirmation.
MACD Vs Awesome Oscillator
If you were to see the AO on a chart, you would not be wrong to think it looks much like that MACD in histogram mode.
You can read more about the moving average convergence divergence indicator in my complete MACD Indicator guide
They are similar in that the histogram shows the difference between a fast moving average and a slow moving average.
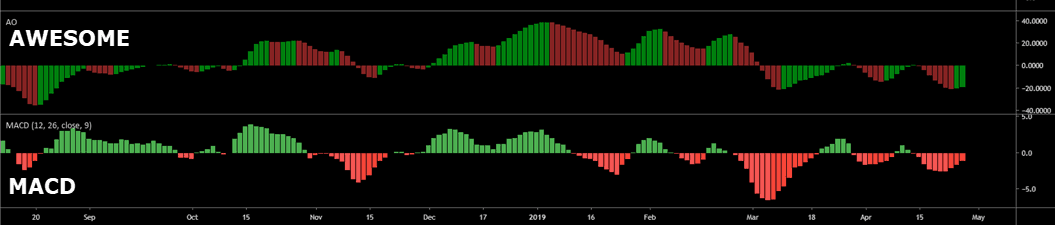 The big difference is in the calculation.
The MACD uses closing prices and a smoothing factor. The AO uses the middle of the high/low of the candlestick or bar chart.
Is that enough to make the claim of being “Awesome”? That is up to you to decide.
Summary
Bill Williams put a twist on the MACD when he designed the Awesome Oscillator. To me, it is simply another oscillator that will give you an insight into the momentum of the market.
Remember, the measure of momentum is actually the difference between two moving averages.
Pairing the AO alongside the patterns I cover in the free Price Pattern E-Book you can download would no doubt improve the usefulness of this indicator.
I would never trade an indicator by itself and the addition of price patterns is something I would recommend.