- May 6, 2024
- Posted by: Shane Daly
- Categories: Trading Article, Trading Indicators
You’ve likely encountered the term ‘technical analysis.’ This method depends on deciphering charts and applying various indicators to forecast market movements. Have you ever wondered how mastering these techniques could enhance your trading performance?
Main Points
- Understanding the fundamental concepts and assumptions of technical analysis is vital for improving trading performance.
- Technical analysis offers numerous advantages, such as identifying optimal entry and exit points, managing risk, and capitalizing on market swings.
- Selecting the right tools, including charts, technical indicators (e.g., RSI, MACD), and chart patterns, is essential for accurate market analysis.
- Developing a technical trading strategy involves combining multiple timeframes, indicators, and chart patterns to enhance decision-making and trade execution.
- Backtesting, optimization, and effective risk management techniques are vital for refining and implementing a successful technical trading strategy.
Understanding Technical Analysis
To enhance your trading performance, you need to grasp the fundamental concepts and assumptions underlying technical analysis.
You’ll discover that this method not only helps in predicting market movements but also gives you the tools to manage risks effectively.
Understanding these principles can benefit your trading strategy, optimizing decision-making and improving your trading success.
Key Concepts and Assumptions
Understanding the key concepts and assumptions of technical analysis is important as they form the foundation upon which all trading strategies are built. Here’s a breakdown of essential elements that you’ll need to grasp:
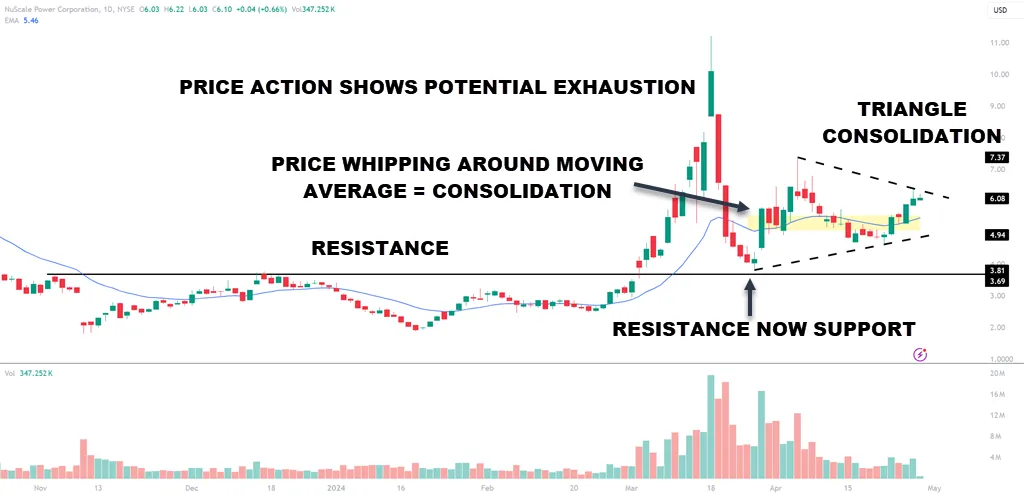
- Price Action: This refers to the movement of security prices plotted over time. It’s the backbone of many technical strategies, especially when identifying trend-following and breakout trading opportunities.
- Support and Resistance Levels: These are key points on charts where the forces of supply and demand meet. They can greatly influence trend reversals or continuations.
- Moving Averages: These are indicators used to smooth out price data and help clarify the direction of the trend. By understanding moving averages, you can better identify potential entry and exit points in the market.
Benefits for Traders
When you have understood the foundational elements of technical analysis, you’ll find that it offers numerous advantages in enhancing your trading efficacy.
For instance, in swing trading, technical analysis enables you to identify optimal entry and exit points based on price patterns and market trends. This approach minimizes guesswork and improves your ability to capitalize on market swings.
Similarly, in momentum trading, technical analysis helps spot securities that exhibit strong movement, allowing you to enter trades aligned with the current momentum for potentially higher gains.
Using stop-loss orders and take-profit orders, guided by technical indicators, helps manage risk effectively by setting predefined points for closing positions, thereby protecting your investments from significant losses and securing profits.
Selecting the Right Tools
In selecting the right tools for technical analysis, you must consider the variety of charts and their specific types, each tailored to distinct market conditions and analysis techniques.
You’ll need to identify essential technical indicators that align with your trading strategy and goals, focusing on those that best predict future market behaviors.
Additionally, mastering the skill of identifying chart patterns is helpful, as these patterns can provide clues into market trends and potential turning points.
Charts and Chart Types
Selecting the appropriate chart type is important for accurately analyzing market trends and optimizing your trading strategies. The chart you choose influences how you’ll apply various analytical tools, such as the relative strength index (RSI), Bollinger Bands, Fibonacci retracements, stochastic oscillators, and MACD (moving average convergence divergence).
Here are 3 most popular chart types:
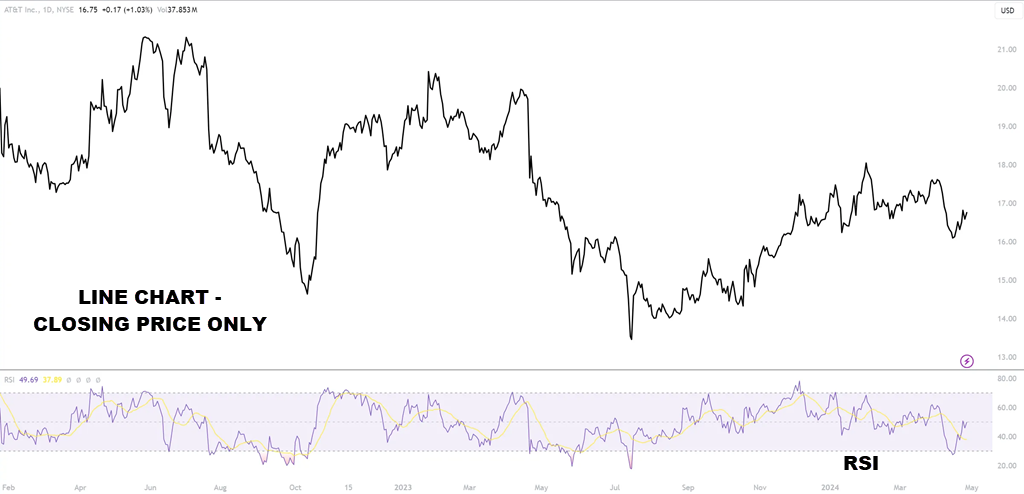
- Line Charts: Ideal for spotting general price trends and simplifying the visualization of data, making it easier to apply tools like the RSI and MACD.
- Bar Charts: Provide more detail than line charts, including opening and closing prices, essential for using Bollinger Bands and stochastic oscillators effectively.
- Candlestick Charts: Offer detailed information on price movements, vital for applying Fibonacci retracements and studying market psychology thoroughly.
Essential Technical Indicators
Trend indicators can help you identify the direction and strength of market movements, while momentum oscillators are crucial for detecting potential reversals before they occur.
Additionally, incorporating volume indicators can provide insights into the intensity behind price movements, offering a more complete analysis of the market.
Trend Indicators
Understanding the appropriate trend indicators can improve your trading strategy by providing clear insights into market directions. Here’s how you can use these tools effectively:
- Relative Strength Index (RSI): Measures momentum to identify overbought or oversold conditions in stocks and forex.
- MACD (Moving Average Convergence Divergence): Helps detect changes in trend momentum and duration.
- Trend Lines: Visual indicators to pinpoint market trends and reversals.
Momentum Oscillators
Before you start diving into specific tools, understand that momentum oscillators are essential technical indicators for identifying the speed of price movements and potential reversals in the market.
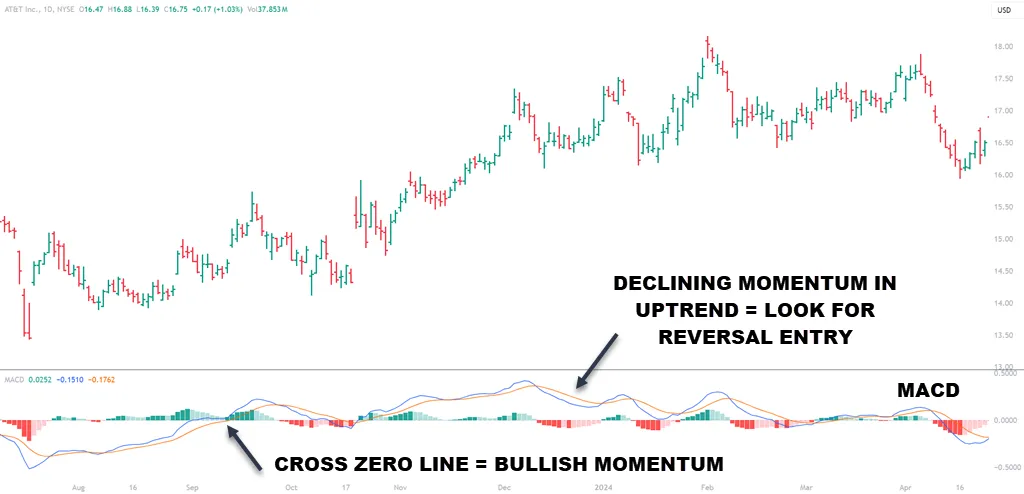
You’ll find the relative strength index (RSI) and MACD (moving average convergence divergence) particularly useful. RSI gauges overbought or oversold conditions, while MACD assesses trend direction and volatility, important for scalping and position trading strategies.
Volume Indicators
Volume indicators are tools that help you analyze the intensity of buying or selling pressure in the market, providing insights into potential continuations or reversals of trends.
Here are three key concepts to keep in mind:
- Diversification: Balance volume indicators with tools like RSI and MACD for a well-rounded strategy.
- Risk-Reward Ratio: Adjust positions based on volume-driven signals for optimal risk management.
- Money Management: Utilize volume data to size trades appropriately.
Volume is useful when looking at trading breakouts where you want to see an increase in volume at the break or soon after. When trading pullbacks, you want to see decreasing volume in the pullback to consider trading a reversal back in the trend direction.
Identifying Chart Patterns
Identifying chart patterns is an important aspect of technical analysis in trading and investing. Chart patterns are visual representations of historical price movements in the form of geometric shapes or patterns on a price chart.
Traders use these patterns to predict future price movements and can also determine the state of the market/instrument they are trading.
There are various types of chart patterns that traders commonly look for, including:
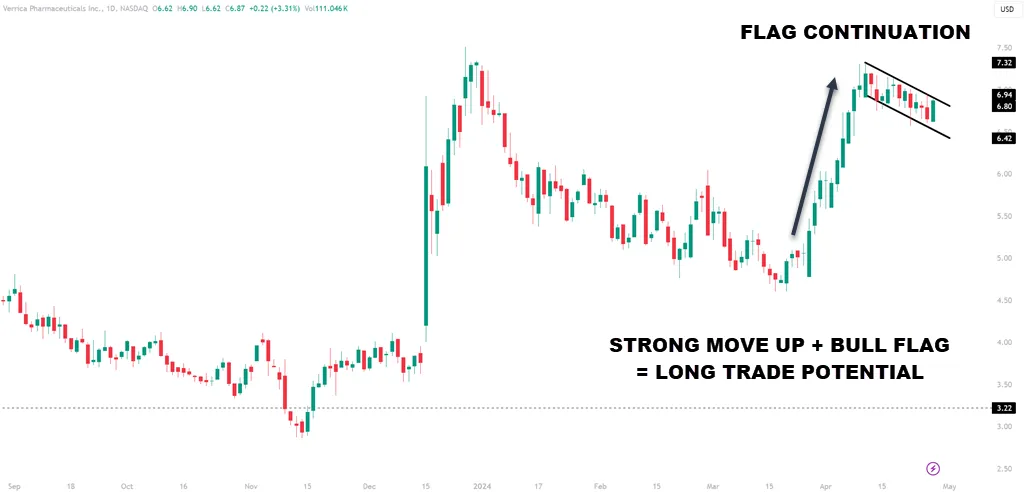
- Continuation Patterns: These patterns suggest that the current trend is likely to continue. Examples include flags, pennants, and triangles.
- Reversal Patterns: These patterns indicate a potential reversal in the current trend. Examples include head and shoulders, double tops, and double bottoms.
- Consolidation Patterns: These patterns suggest a period of indecision in the market, often before a significant price movement. Examples include rectangles and wedges.
- Breakout Patterns: These patterns occur when the price breaks out of a key level of support or resistance, signaling a potential strong continuation of the trend.
Identifying these patterns involves a combination of technical analysis tools such as trendlines, support and resistance levels, moving averages, and volume indicators. Traders also consider the duration of the pattern, the reliability of the pattern based on historical performance, and the overall market context before making trading decisions based on chart patterns.
It is important for traders to not rely solely on chart patterns but to use them in conjunction with other forms of analysis to make their trading decisions. It’s essential to be aware of the limitations and potential pitfalls of relying too heavily on chart patterns, as market conditions can change quickly and patterns may not always play out as expected.
Developing a Technical Trading Strategy
To develop a robust technical trading strategy, you may want to integrate multiple timeframes to enhance market perspective and potential entry or exit points.
Consider combining various indicators and chart patterns to filter signals and increase accuracy in your trades.
Additionally, backtesting and optimization of your strategy, coupled with effective risk management techniques, are essential to mitigate losses and maximize gains.
Combining Multiple Timeframes
When developing a technical trading strategy, integrating multiple timeframes can greatly enhance your decision-making process by providing a more thorough view of market trends. Using a combination of timeframes helps you grasp both long-term movements and short-term fluctuations.
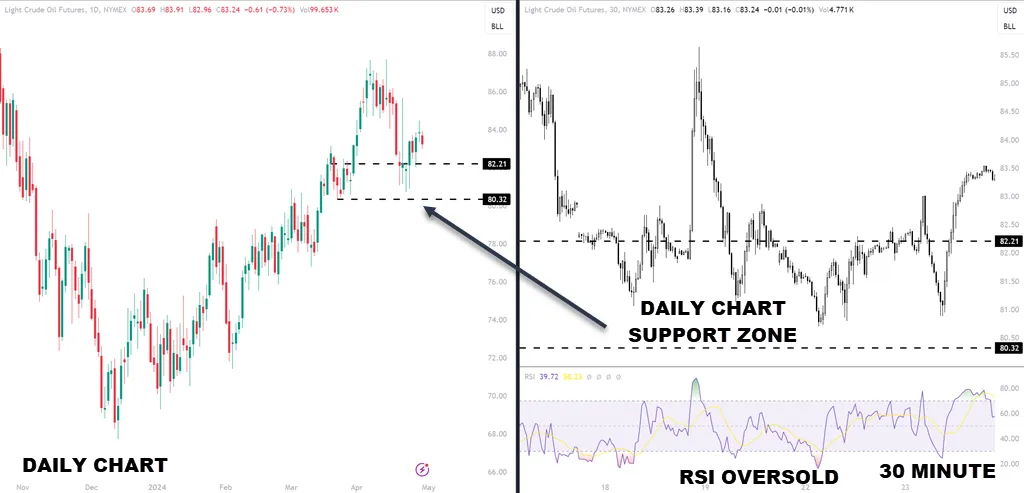
Here’s how you can effectively combine timeframes:
- Use Long-Term Timeframes to establish the overall market trend and identify potential reversals.
- Apply Mid-Term Timeframes to fine-tune entry and exit points, using tools like MACD (Moving Average Convergence Divergence) and RSI (Relative Strength Index).
- Incorporate Short-Term Timeframes for precision in executing trades, especially beneficial in highly volatile markets.
In the chart example above, the daily chart is in a support zone and holding. On the 30-minute chart, traders could use the 9 Period RSI (faster for intraday trading) when in oversold condition and downsloping trendline breaks for day trade positions.
This methodical approach ensures a thorough analysis, increasing your chances of successful trades.
Combine Indicators and Chart Patterns
Integrating indicators and chart patterns sharpens your technical trading strategy, allowing you to identify key trends and signals with greater accuracy. Using the Relative Strength Index (RSI) and MACD (Moving Average Convergence Divergence), you can gauge momentum and potential reversals. RSI, a momentum oscillator, helps you understand overbought or oversold conditions in commodities, while MACD highlights changes in the strength, direction, and duration of a trend.

Combining these tools with fundamental analysis enhances your market insight, informing your position-sizing decisions effectively. I will often size a position larger when the trade is accompanied by a catalyst such as earnings or has a massive amount of volume.
By analyzing chart patterns alongside these indicators, you’ll pinpoint more precise entry and exit points, optimizing your trade execution.
Backtesting and Optimization
Backtesting your technical trading strategy allows you to assess its historical performance and identify areas for optimization. By simulating how your strategy would have performed using historical data, you can refine it for better results. Here’s a 3 step process to get you started:
- Select Key Indicators: Incorporate tools like MACD (Moving Average Convergence Divergence) and RSI (Relative Strength Index) to gauge market momentum and trends.
- Analyze Performance: Evaluate the success rate, identifying when the strategy fails. This analysis fosters patience and emotional control, valuable for trading.
- Optimize Parameters: Adjust indicator settings to maximize effectiveness. This step builds confidence in your strategy’s robustness.
Methodically refining your approach with these steps ensures a reliable, performance-driven trading strategy.
Risk Management Techniques
As you develop your technical trading strategy, it’s vital to implement risk management techniques that safeguard your account from excessive losses. We all lose but it’s the size of the losses that make a difference.
Utilizing tools like the Relative Strength Index (RSI) and MACD (Moving Average Convergence Divergence) can help in this effort. RSI helps you identify overbought or oversold conditions that might signal potential reversals. Meanwhile, MACD provides insights into the momentum behind price movements, allowing for decisions based on price losing momentum in the direction of the position.
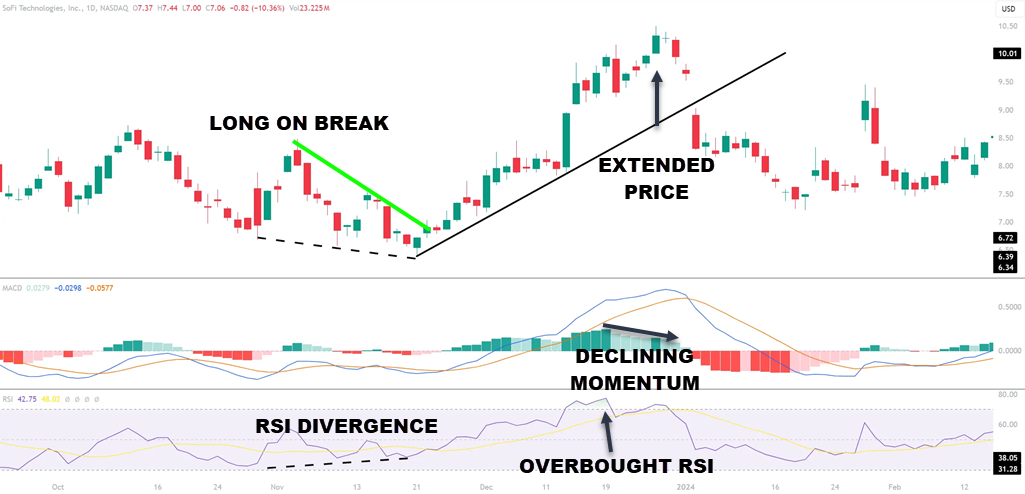
Imagine you spotted RSI divergence on the chart and took a long trade on the break of the green trend line. After a run in price, the price action pulls away from the trendline and is now extended. You see declining momentum in the MACD and the RSI is overbought. All signs point to at least a consolidation and traders would want to adjust their stop to lock in gains.
Adaptability is key; as market conditions evolve, so should your approach. Adjust your strategy based on real-time data analysis and historical performance metrics. By methodically applying these indicators, you’ll enhance your ability to manage risks effectively, thereby preserving your capital while seeking profitable opportunities.
Frequently Asked Questions
How Can Technical Analysis Be Applied to Different Asset Classes?
To apply technical analysis to different asset classes, study price patterns and indicators specific to each market. Develop strategies based on historical price movements and volume data. Adapt your approach to the unique characteristics of each asset type for optimal results.
Are There Any Common Mistakes to Avoid When Using Technical Tools?
When using technical tools, avoid common mistakes like overtrading based on emotions, neglecting risk management, and failing to adapt to changing market conditions. Stay disciplined, and patient, and constantly refine your strategies for success.
What Are the Key Differences Between Leading and Lagging Indicators?
When distinguishing leading and lagging indicators, focus on their timing. Leading indicators precede price movements, offering potential predictive insights. Lagging indicators follow price changes, confirming trends. Understanding these differences can help refine your trading strategies effectively.
Can Technical Analysis Be Used Effectively in Volatile Markets?
In volatile markets, you can benefit from technical analysis by identifying trends and patterns to make informed trading decisions. This strategy helps you navigate market fluctuations and capitalize on opportunities for successful trades.
Conclusion
Adding technical analysis to your trading strategy can enhance your performance. By understanding key indicators and trends, selecting the right tools, and developing a solid strategy, you can make better decisions and increase your chances of success in the market.