- November 29, 2023
- Posted by: Shane Daly
- Categories: Advanced Trading Strategies, Trading Article

Are you looking to enhance your trading strategy in the stock market or forex trading? Then the Moving Momentum Trading Strategy might be just what you need. This systematic approach combines momentum indicators, technical analysis, and a disciplined process to help you identify high-probability trading opportunities within trending markets.

By utilizing moving averages, a Stochastic Oscillator, and a MACD-Histogram, this comprehensive trading strategy allows you to pinpoint corrections within a trending environment. Whether you’re a seasoned trader or just starting out, this strategy can be applied to various financial markets, including stocks and forex.
Key Takeaways:
- The Moving Momentum Trading Strategy is a systematic approach to trading in trending markets.
- It combines momentum indicators, technical analysis, and a disciplined process.
- It involves using moving averages, a Stochastic Oscillator, and a MACD-Histogram to identify high-probability trading opportunities.
Trading Rules – Moving Momentum Strategy
The Moving Momentum Strategy strategy consists of a long trading strategy and a short trading strategy, each with its own set of rules which are the opposite of each other.
For taking a long position with this strategy, there are three key indicators to consider.
- 20-period Simple Moving Average (SMA) should be above the 150-period SMA. This indicates an overall uptrend in the market.
- Slow Stochastic indicator (14,3) should fall below the 20 level. This signifies a pullback in the price and presents a potential buying opportunity.
- MACD Histogram (12,26,9) should move above zero, providing confirmation for a bullish trade entry or exit.
Looking short? For this strategy, the 20-period SMA should be below the 150-period SMA, indicating a bearish bias. The Slow Stochastic (14,3) should rise above the 80 level, suggesting a bounce, and the MACD Histogram (12,26,9) should move below zero, confirming a bearish signal.
| Long Trading Strategy | Short Trading Strategy |
|---|---|
| 20-period SMA above 150-period SMA
Slow Stochastic (14,3) below 20 MACD Histogram (12,26,9) above zero |
20-period SMA below 150-period SMA
Slow Stochastic (14,3) above 80 MACD Histogram (12,26,9) below zero |
By following these trading rules, you can find potential trading opportunities using the Moving Momentum Strategy. These rules serve as guidelines and should be used with other technical analysis tools and indicators to make decisions (make sure you have a trading strategy).
Long Trading Strategy
In the Moving Momentum Trading Strategy, the long trading strategy focuses on identifying and capitalizing on uptrends in the market. The key component in this strategy is the use of moving averages to determine the trend direction. The 20-period simple moving average (SMA) is used as a reference point when compared with the 150 SMA. When the 20-period SMA is above the 150-period SMA, it indicates a bullish bias.
| Indicator | Threshold | Bullish Signal |
|---|---|---|
| 20-period SMA | 20-period SMA > 150-period SMA | Bullish bias |
| Stochastic Oscillator | Falling below 20 | Pullback identified |
| MACD Histogram | Moving above zero | A bullish signal for trade entry or exit |
To further confirm the uptrend, you want to look for a pullback in price (bull flag). This is identified using the Stochastic Oscillator, with the indicator falling below 20. The Stochastic Oscillator is a momentum indicator that compares the closing price of a security to its price range over a given time period. A reading below 20 suggests that the security is oversold and may experience a bounce.
For trade entry or exit signals, you can use the MACD Histogram. The MACD (Moving Average Convergence Divergence) is a trend-following momentum indicator that shows the relationship between two moving averages of an asset’s price. When the MACD Histogram moves above zero, it provides a bullish signal, indicating that the price is gaining upward momentum and potential buying opportunities may arise.
Short Trading Strategy
The short trading strategy focuses on identifying downtrends in the market, allowing you to take advantage of potential profit opportunities in declining instruments.
The short trading strategy utilizes the same indicators as before in the opposite way.
- Moving Averages: The 20-period SMA must be below the 150-period SMA, indicating a bearish bias.
- Stochastic Oscillator: The Slow Stochastic (14,3) should rise above 80, suggesting a bounce in the market.
- MACD Histogram: The MACD Histogram (12,26,9) should move below zero, confirming a bearish signal.
By watching these indicators (set alerts if possible) and understanding their meaning, you can identify and capitalize on downtrends in the market.
Implementing the Strategy
Once the indicators align for a trade, it’s time to implement the short trading strategy. This involves taking a bearish position in the market and monitoring price movements for potential profit opportunities. Remember to set appropriate stop-loss orders to manage risk and protect your capital.
It’s important to note that while the short trading strategy provides a structured approach, it’s crucial to consider additional factors such as market conditions, news events, and overall trend direction.
Moving Momentum Trading Examples
Let’s explore a couple of Moving Momentum Trading Strategy examples in both bullish and bearish trends. These examples will showcase how the strategy’s indicators, particularly the MACD Histogram, can help cement what you just learned.
Bullish Trend: FEDX (FDX)
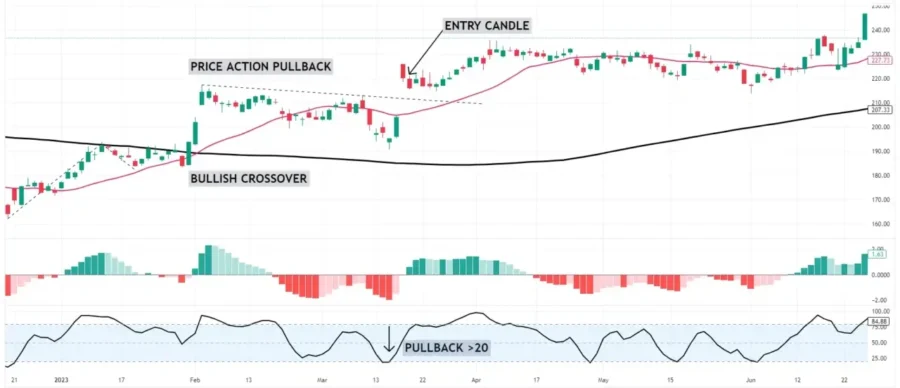 In this winning trade example, Fedex exhibited a clear bullish price action trend. Shifting to the Moving Momentum Strategy, we see that the 20-period simple moving average (SMA) rose above the 150-period SMA, indicating an upward trend as per the strategy.
The Slow Stochastic fell below 20, suggesting a pullback. We can see a pullback (complex pullback) take place in the price. Once the MACD Histogram moved above zero (going positive), signaling a potential long trading opportunity. Traders can enter at the close of the candle or set an order above the high which only triggers if the price continues to the upside.
These bullish indicators aligned, providing a solid basis for entering a long trade on FDX. Traders who followed this strategy would have capitalized on the corrective move within the overall uptrend, potentially yielding profitable results depending on their take-profit strategy.
Bullish Trend: OVERSTOCK (OSTK)
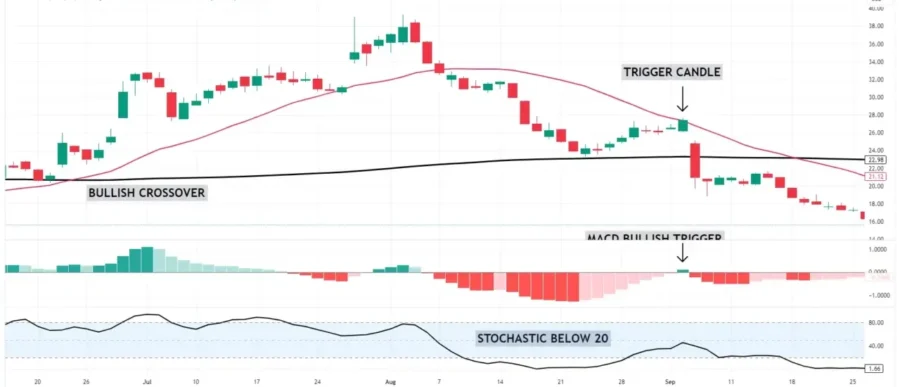 The Moving Momentum Strategy identified a bullish crossover of the moving averages, with the 20-period SMA risking above the 150-period SMA, telling us only buy triggers are on. Despite this bullish signal, the subsequent price action prevented a successful trade as the price tanked to the downside.
“It is essential to consider price movement alongside the strategy’s indicators to make better trading decisions. While the Moving Momentum Strategy provides a structured framework, understanding the context and price behavior is crucial for successful implementation.”
This example is a lesson in the significance of incorporating price action analysis into trading decisions. You can see that the price had strong momentum to the upside along with momentum to the downside. We do not want to see momentum against the trend in a pullback if considering a long trade (rule of thumb).
Tweaking the Moving Momentum Strategy
While the Moving Momentum Strategy provides a robust framework for trading in trending markets, it’s important for traders to have the flexibility to adapt the strategy to their individual needs. By making tweaks to the settings of the indicators, you can customize them to suit your trading instruments and preferences.
One area where you can make adjustments is the period lengths of the moving averages. The choice of moving average lengths will depend on the time frame you are trading and the level of sensitivity you desire. Longer moving averages will provide a broader view of the trend, while shorter moving averages will be more responsive to price fluctuations.
Another parameter that can be tweaked is the Stochastic Oscillator. By changing the settings, such as the lookback period and the oversold/overbought levels, you can increase or decrease the sensitivity of the oscillator. This adjustment can help you fine-tune the pullback depth you need to consider a trade.
The MACD-Histogram is another component of the Moving Momentum Strategy that can be adjusted. Changing the settings, such as the fast and slow periods, or the signal line period, can impact the strength and accuracy of the signals generated.
Experimenting with different configurations can help you find the settings that align best with your trading style and the volatility of the security you are trading. Always test any changes you make before putting money on the line.
Determining the Right Balance
When changing the Moving Momentum Strategy, it’s important to strike the right balance. Increasing sensitivity may generate more signals, but it could also result in more false signals. Reducing sensitivity may filter out noise, but it could potentially lead to missed trading opportunities. Finding the optimal settings that provide reliable signals without excessive noise is key to maximizing the strategy’s effectiveness.
| Parameter | Possible Adjustments |
|---|---|
| Moving Averages | Period lengths |
| Stochastic Oscillator | Lookback period, oversold/overbought levels |
| MACD-Histogram | Fast and slow periods, signal line period |
By experimenting with these parameters and finding the optimal settings that suit your trading style and the volatility of the market, you can enhance the Moving Momentum Strategy’s performance and increase your chances of success in the financial markets.
Profit Targets + Stop Loss
The targets you set will be unique to you and can be as simple as looking for a multiple of the risk amount. Setting your stop loss can be done using ATR readings or using the swing high/low after trade entry. Starting out, consider using 1-3 times your risk and learn how to manage your trades as they move in your direction. With experience, consider using trailing stop especially if you are entering a new trend direction.
Conclusion
The Moving Momentum Trading Strategy offers a systematic approach to trading in trending markets. By following a structured process (your trading plan) that incorporates moving averages, a Stochastic Oscillator, and a MACD-Histogram, you can identify potential trading opportunities in the instruments you enjoy trading.
This strategy should be just one tool in your trading arsenal. While it provides an excellent framework for decision-making, consider price action and make adjustments based on your own risk tolerance, experience, and trading preferences.
FAQ
What is the Moving Momentum Trading Strategy?
The Moving Momentum Trading Strategy is a robust approach to finding corrections within trending markets for high-probability trading opportunities. It involves using moving averages, the Stochastic Oscillator, and the MACD-Histogram to identify and capitalize on corrective moves within trends.
How do I use the Moving Momentum Strategy?
The strategy consists of three steps: 1) identifying the long-term trend using moving averages, 2) identifying pullbacks using the Stochastic Oscillator, and 3) using the MACD-Histogram as a signal for trade entry or exit. The trading rules differ for long and short strategies, which involve specific conditions for moving averages, Stochastic Oscillator, and MACD-Histogram.
Can the Moving Momentum Strategy be applied to different financial markets?
The Moving Momentum Strategy can be applied to various financial markets, including stocks and forex. It’s important to consider the volatility of the actual instrument and make adjustments to the strategy parameters to suit.
What are the key indicators for the long trading strategy?
In the long trading strategy, the key indicators are the 20-period simple moving average (SMA) above the 150-period SMA, the Slow Stochastic (14,3) falling below 20, and the MACD Histogram (12,26,9) moving above zero.
What are the key indicators for the short trading strategy?
In the short trading strategy, the key indicators are the 20-period SMA below the 150-period SMA, the Slow Stochastic (14,3) rising above 80, and the MACD Histogram (12,26,9) moving below zero.
How do I identify uptrends using the long trading strategy?
In the long trading strategy, an uptrend is identified when the 20-period SMA is above the 150-period SMA. A bullish bias is established, and pullbacks are indicated when the Slow Stochastic falls below 20. The MACD Histogram moving above zero provides a bullish signal.
How do I identify downtrends using the short trading strategy?
In the short trading strategy, a downtrend is identified when the 20-period SMA is below the 150-period SMA. A bearish bias is established, and bounces are indicated when the Slow Stochastic rises above 80. The MACD Histogram moving below zero confirms a bearish signal.
Can I adjust the parameters of the Moving Momentum Strategy?
Yes, you can adjust the parameters of the Moving Momentum Strategy to suit your trading instruments and preferences. This includes modifying the period lengths of moving averages, Stochastic Oscillator, and MACD-Histogram to increase or decrease sensitivity.
Unlock Your Trading Potential!
Trading Indicator Blueprint
Discover the secrets behind popular trading indicators like Moving Averages, Keltner Channels, Stochastics, MACD, and more.
While others might charge $197 for such insights, we’re offering it to you for FREE!
📚 50+ Pages
🎥 4 Professional Videos
📈 Actionable Trading Systems